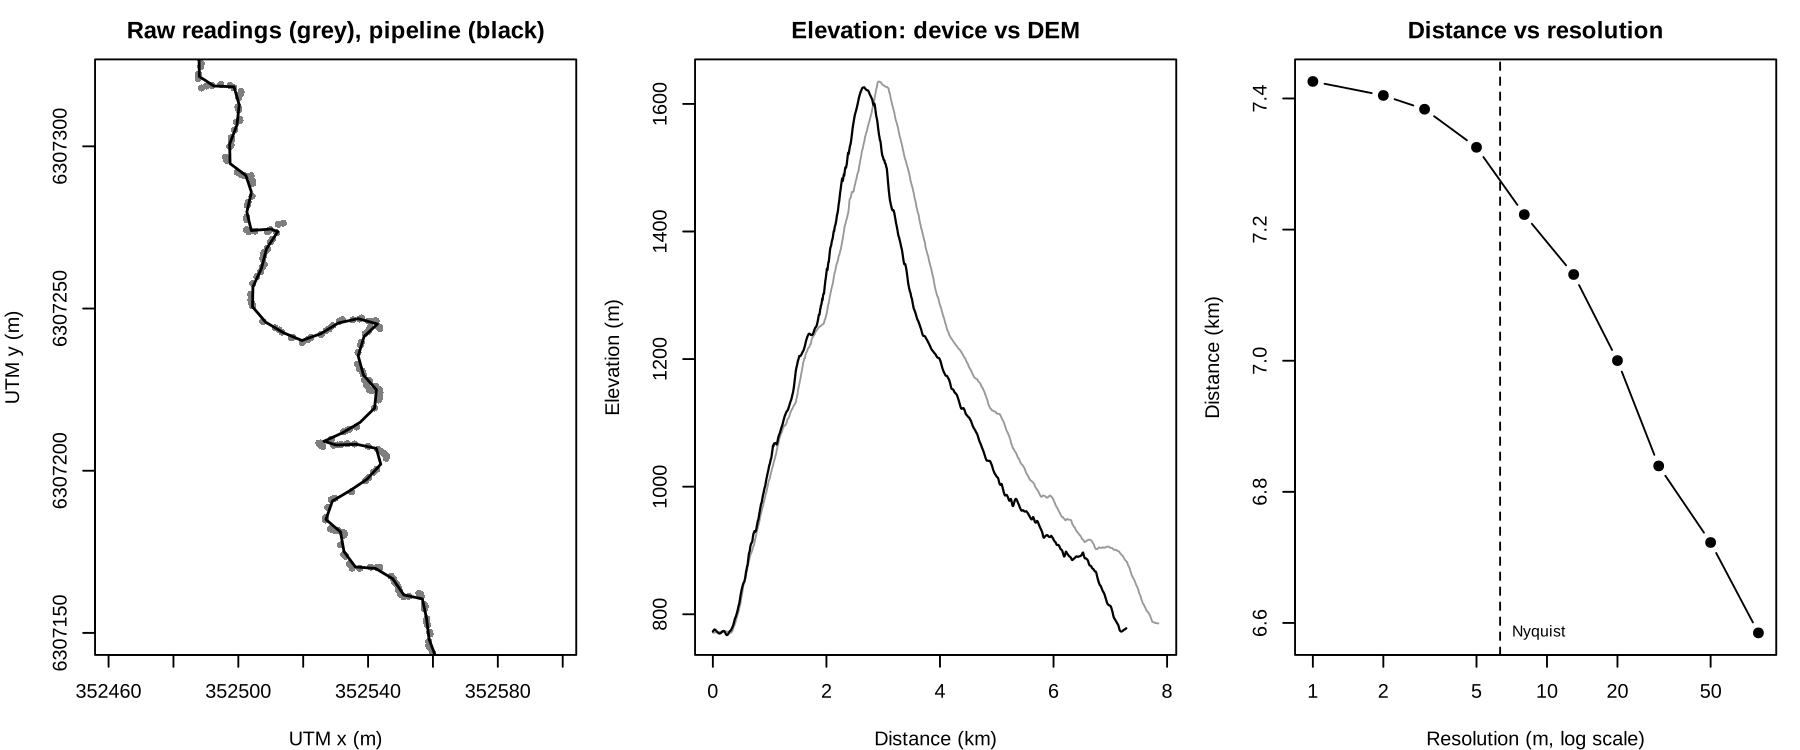
metrictrails is an R package to read, clean and standardise GNSS streams recorded by sports watches and similar devices, with a focus on trail and mountain running. It is the successor of GPStream and implements the methods of the Metric Trails research papers (see References).
A stream is any sequence of consecutive readings with
lon and lat, and optionally ele,
timestamp, time, heart rate, cadence and other
variables.
# install.packages("remotes")
remotes::install_github("raimun2/metrictrails")A full walkthrough is in the vignette:
vignette("metrictrails").
| step | function | what it does |
|---|---|---|
| 1. ingest | read_stream() |
reads a GPX file with sf (tracks or routes, segments and Garmin extensions) |
| 2. naming convention | uniform_stream() |
renames columns to lon, lat, ele, timestamp, time |
| 3. sanitize | sanitize_stream() |
smooths lon/lat (Kalman by default; LOESS, Gaussian
kernel, Savitzky-Golay or the full ICECET 2026 pipeline) and flags
implausible readings |
| 4. resample | resolution_stream(),
resample_stream() |
resamples to a uniform 2D spatial resolution derived from the Nyquist criterion |
| 5. elevation | get_dem(), resample_dem(),
ele_correction() |
replaces elevation with values from a Digital Elevation Model |
library(metrictrails)

f = system.file("extdata", "gpx_activity.gpx", package = "metrictrails")
dem = system.file("extdata", "test_dem.tif", package = "metrictrails")

raw = read_stream(f) %>% uniform_stream()
raw
#> # A tibble: 2,510 x 9
#>     lon   lat   ele timestamp            time segment atemp    hr   cad
#>   <dbl> <dbl> <dbl> <dttm>              <dbl>   <int> <dbl> <dbl> <dbl>
#> 1 -70.6 -33.4  772  2020-08-10 19:36:38     0       1    27   106    47
#> 2 -70.6 -33.4  771  2020-08-10 19:36:39     1       1    27   108    47
#> 3 -70.6 -33.4  772. 2020-08-10 19:36:42     4       1    27   111    76
#> # i 2,507 more rows

final = raw %>%
  sanitize_stream() %>%       # Kalman smoothing + red flags
  resample_stream() %>%       # Nyquist resolution
ele_correction(dem = dem) # DEM elevation (omit `dem` to download one)Flags are computed on the raw readings. Position flags (time, speed,
acceleration, edge jumps) and elevation flags (slope, vertical speed,
elevation change while idle) can be kept, dropped or interpolated
(action).
clean = sanitize_stream(raw)
attr(clean, "sanitize_report")$counts
#>       flag_time      flag_speed      flag_accel       flag_jump      flag_slope
#>               0               0               0               0              71
#> flag_vert_speed   flag_idle_ele        flag_gap    flag_low_res
#> 3 3 0 10A watch that records at a fixed rate produces a spatial resolution
that is a random variable (speed times sampling interval), so distance
and elevation gain depend on how fast the athlete moved.
resolution_stream() describes the distribution of the 2D
distance between moving readings. Its 0.9 quantile is the finest uniform
spacing that represents the path without inventing readings, and
resample_stream() uses it by default. To compare several
streams, resample all of them with one common res.
resolution_stream(clean)
#> # A tibble: 1 x 12
#>       n pct_idle  mean    sd   q05   q25   q50   q75   q95   max     q   res
#>   <int>    <dbl> <dbl> <dbl> <dbl> <dbl> <dbl> <dbl> <dbl> <dbl> <dbl> <dbl>
#> 1 2510 0.0797 2.97 3.07 0.512 1.08 2.00 3.49 9.10 22.8 0.9 6.31get_dem() downloads AWS Terrain Tiles (zoom 14, about 4
m at the latitude of Santiago) for the extent of the stream and projects
them to its UTM zone. resample_dem() refines the DEM by
bilinear interpolation, or aggregates it.
cols = c("distance_2d", "elevation_gain", "km_effort", "resolution", "fractal_dim")
summarise_stream(raw, fractal = TRUE)[, cols]     # raw device
#> # A tibble: 1 x 5
#>   distance_2d elevation_gain km_effort resolution fractal_dim
#>         <dbl>          <dbl>     <dbl>      <dbl>       <dbl>
#> 1       7847.           889.      16.7       3.13        1.07
summarise_stream(final, fractal = TRUE)[, cols]   # after the pipeline
#> # A tibble: 1 x 5
#>   distance_2d elevation_gain km_effort resolution fractal_dim
#>         <dbl>          <dbl>     <dbl>      <dbl>       <dbl>
#> 1       7281.           951.      16.8       6.16        1.08

tobler_stream(final)   # speed-slope frontier (90th percentile)
#> # A tibble: 1 x 8
#>      v1    m1 c_plus c_minus   tau     n    r1 method
#>   <dbl> <dbl>  <dbl>   <dbl> <dbl> <int> <dbl> <chr>
#> 1 3.30 0.148 3.40 -0.0248 0.9 1083 0.236 pinballdifferential_stream(): per-reading distance, elevation
change, slope, heading change, speed, acceleration and pace.summarise_stream(): 2D and 3D distance, elevation gain
and loss, slope, sinuosity, km-effort, idle time and fractal dimension,
per stream or per group.fractal_stream(): fractal dimension of the path with
the divider (Richardson) method.tobler_stream(), tobler_speed():
asymmetric Tobler hiking function fitted to a speed quantile (quantile
regression in base R).route = read_stream(system.file("extdata", "gpx_route.gpx", package = "metrictrails"))
# predicate: does the stream follow the route, and where?
detect_stream(raw, route)
#> # A tibble: 1 x 6
#> pass start_row end_row direction coverage status
#> <int> <int> <int> <chr> <dbl> <chr>
#> 1 1 1 2506 forward 1 match
# transformation: where was the athlete along a known reference at each time?
ref = route %>% resample_stream(res = 2) %>% ele_correction(dem = dem)
matched = match_stream(clean, ref, params = tobler_stream(final))
summary(matched$offset_d) # distance from each reading to its matched position
#> Min. 1st Qu. Median Mean 3rd Qu. Max.
#> 0.05679 4.30900 7.17398 8.98717 11.64175 45.55705project_stream(): adds UTM coordinates x,
y (the projection used internally for every distance).locate_stream(): linear referencing; position along a
reference and signed cross-track distance of every reading, without
constraints.compare_stream(): Hausdorff distance, separation and
Metric Score between two streams.detect_stream(): passes of a stream along a route, with
direction and coverage.match_stream(): map matching to a reference trail that
the athlete is known to have followed. The match is monotone and limited
by the Tobler speed ceiling, and the global optimum is found by dynamic
programming (Viterbi). It returns the matched position and the offset of
every reading, split into along-track and cross-track components.write_stream(): writes a stream to GPX.strava_streams, strava_metadata: streams
and metadata of two activities from the Strava API.inst/extdata: a GPX activity with heart rate, cadence
and temperature, the same loop as a GPX route, and a small DEM of the
area.Use citation("metrictrails") to cite the package.
MIT © Raimundo Sanchez