| Title: | Convenience Functions for Package 'lavaan' |
| Version: | 0.2.2 |
| Date: | 2025-09-14 |
| Description: | Affords an alternative, vector-based syntax to 'lavaan', as well as other convenience functions such as naming paths and defining indirect links automatically, in addition to convenience formatting optimized for a publication and script sharing workflow. |
| License: | MIT + file LICENSE |
| URL: | https://lavaanExtra.remi-theriault.com |
| BugReports: | https://github.com/rempsyc/lavaanExtra/issues |
| Depends: | R (≥ 3.5) |
| Imports: | lavaan, insight |
| Suggests: | rempsyc (> 0.1.6), flextable, lavaanPlot, DiagrammeRsvg, rsvg, png, webshot, tidySEM, tmvnsim, knitr, tibble, sjlabelled, stringdist, psych, testthat (≥ 3.0.0), rmarkdown, markdown, covr, spelling |
| Config/testthat/edition: | 3 |
| Encoding: | UTF-8 |
| RoxygenNote: | 7.3.3 |
| VignetteBuilder: | knitr |
| Language: | en-US |
| NeedsCompilation: | no |
| Packaged: | 2025-09-15 14:11:38 UTC; there |
| Author: | Rémi Thériault  [aut, cre]
 |
| Maintainer: | Rémi Thériault <remi.theriault@mail.mcgill.ca> |
| Repository: | CRAN |
| Date/Publication: | 2025-09-15 14:30:02 UTC |
lavaanExtra: Convenience Functions for Package 'lavaan'
Description
![]()
Affords an alternative, vector-based syntax to 'lavaan', as well as other convenience functions such as naming paths and defining indirect links automatically, in addition to convenience formatting optimized for a publication and script sharing workflow.
Author(s)
Maintainer: Rémi Thériault remi.theriault@mail.mcgill.ca (ORCID)
See Also
Useful links:
Fit and plot CFA simultaneously
Description
Prints and saves CFA fit, as well as plots CFA factor loadings, simultaneously.
Usage
cfa_fit_plot(
  model,
  data,
  covs = FALSE,
  estimator = "MLR",
  remove.items = "",
  print = TRUE,
  save.as.pdf = FALSE,
  file.name,
  ...
)
Arguments
model |
CFA model to fit. |
data |
Data set on which to fit the CFA model. |
covs |
Logical, whether to include covariances on the lavaan plot. |
estimator |
What estimator to use for the CFA. |
remove.items |
Optional, if one wants to remove items from the CFA model without having to redefine it completely again. |
print |
Logical, whether to print model summary to console. |
save.as.pdf |
Logical, whether to save as PDF for a high-resolution, scalable vector graphic quality plot. Defaults to saving to the "/model" subfolder of the working directory. If it doesn't exist, it creates it. Then automatically open the created PDF in the default browser. Defaults to false. |
file.name |
Optional (when |
... |
Arguments to be passed to function lavaan::cfa. |
Value
The function returns a lavaan fit object. However, it also: prints
a summary of the lavaan fit object to the console, and; prints a
lavaanPlot of the lavaan fit object.
Illustrations
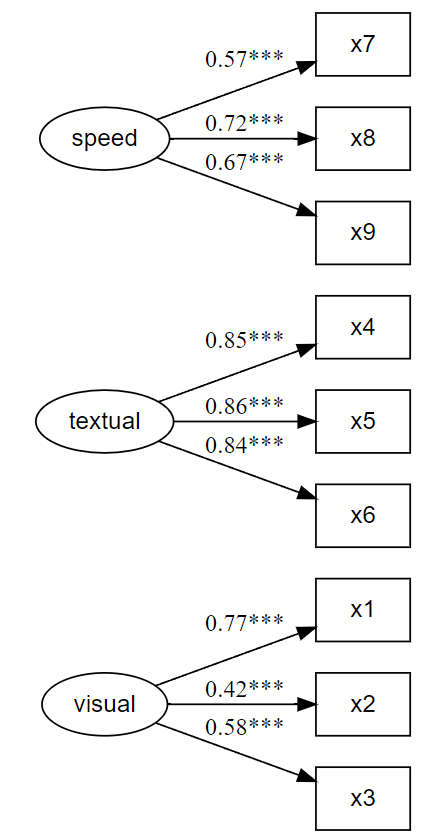
Examples
x <- paste0("x", 1:9)
(latent <- list(
  visual = x[1:3],
  textual = x[4:6],
  speed = x[7:9]
))

HS.model <- write_lavaan(latent = latent)
cat(HS.model)

library(lavaan)
fit <- cfa_fit_plot(HS.model, HolzingerSwineford1939)
Extract relevant covariance/correlation indices from lavaan model
Description
Extract relevant covariance/correlation indices from lavaan lavaan::parameterEstimates and lavaan::standardizedsolution.
Usage
lavaan_cov(fit, nice_table = FALSE, ...)

lavaan_cor(fit, nice_table = FALSE, ...)
Arguments
fit |
lavaan fit object to extract covariance indices from |
nice_table |
Logical, whether to print the table as a rempsyc::nice_table as well as print the reference values at the bottom of the table. |
... |
Arguments to be passed to rempsyc::nice_table |
Value
A dataframe of covariances/correlation, including the covaried variables, the covariance/correlation, and corresponding p-value.
Functions
-
lavaan_cor(): Shortcut forlavaan_cov(fit, estimate = "r")
Examples
x <- paste0("x", 1:9)
(latent <- list(
  visual = x[1:3],
  textual = x[4:6],
  speed = x[7:9]
))

(regression <- list(
  ageyr = c("visual", "textual", "speed"),
  grade = c("visual", "textual", "speed")
))

(covariance <- list(speed = "textual", ageyr = "grade"))

HS.model <- write_lavaan(
  regression = regression, covariance = covariance,
  latent = latent, label = TRUE
)
cat(HS.model)

library(lavaan)
fit <- sem(HS.model, data = HolzingerSwineford1939)
lavaan_cov(fit)
Extract relevant user-defined parameter (e.g., indirect or total effects) indices from lavaan model
Description
Extract relevant user-defined parameters (e.g., indirect or total effects) indices from lavaan model through lavaan::parameterEstimates and lavaan::standardizedsolution.
Uncertainty for standardized coefficients: When standardized_se = "delta",
standard errors (SE) and confidence intervals (CI) for standardized coefficients
are computed via the delta method (as in lavaan::standardizedsolution).
When standardized_se = "bootstrap", CIs for standardized coefficients are
obtained from the bootstrap distribution of the standardized statistic
(std.all) returned by lavaan::parameterEstimates with standardized = TRUE.
In this case, lavaan reports SE for the corresponding unstandardized parameter;
a bootstrap SE for standardized coefficients is not provided by lavaan.
lavaanExtra preserves this behavior and labels the SE source in the output.
The default standardized_se = "model" chooses "bootstrap" if the fitted
model used se = "bootstrap" (and bootstrap > 0), and "delta" otherwise.
Usage
lavaan_defined(
  fit,
  underscores_to_symbol = "→",
  lhs_name = "User-Defined Parameter",
  rhs_name = "Paths",
  standardized_se = "model",
  nice_table = FALSE,
  ...
)
Arguments
fit |
lavaan fit object to extract fit indices from |
underscores_to_symbol |
Character to convert underscores to arrows in the first column, like for indirect effects. Default to the right arrow symbol, but can be set to NULL or "_", or to any other desired symbol. It is also possible to provide a vector of replacements if they they are not all the same. |
lhs_name |
Name of first column, referring to the left-hand side expression (lhs). |
rhs_name |
Name of first column, referring to the right-hand side expression (rhs). |
standardized_se |
Character string indicating the method to use for
computing standard errors and confidence intervals of standardized estimates.
Options are "model" (default, auto-detects based on model fitting method),
"delta" (uses delta method via lavaan::standardizedsolution), or
"bootstrap" (uses bootstrap method via lavaan::parameterEstimates with
|
nice_table |
Logical, whether to print the table as a rempsyc::nice_table as well as print the reference values at the bottom of the table. |
... |
Arguments to be passed to rempsyc::nice_table |
Value
A dataframe, including the indirect effect ("lhs"),
corresponding paths ("rhs"), standardized regression
coefficient ("std.all"), corresponding p-value, as well
as the unstandardized regression coefficient ("est") and
its confidence interval ("ci.lower", "ci.upper"). When
standardized_se = "delta", standardized SE and CI
are computed using the delta method. When standardized_se = "bootstrap", standardized CI are computed using bootstrap
and SE represents the unstandardized bootstrap SE (lavaan
limitation). The SE computation method is stored as an
attribute (standardized_se_method) for verification.
Examples
x <- paste0("x", 1:9)
(latent <- list(
  visual = x[1:3],
  textual = x[4:6],
  speed = x[7:9]
))

(mediation <- list(
  speed = "visual",
  textual = "visual",
  visual = c("ageyr", "grade")
))

(indirect <- list(
  IV = c("ageyr", "grade"),
  M = "visual",
  DV = c("speed", "textual")
))

HS.model <- write_lavaan(mediation,
  indirect = indirect,
  latent = latent, label = TRUE
)
cat(HS.model)

library(lavaan)
fit <- sem(HS.model, data = HolzingerSwineford1939)
lavaan_defined(fit, lhs_name = "Indirect Effect")
Extract relevant indices from lavaan model based on specified operator
Description
Extract relevant indices from lavaan model through lavaan::parameterEstimates and lavaan::standardizedsolution.
Uncertainty for standardized coefficients: When standardized_se = "delta",
standard errors (SE) and confidence intervals (CI) for standardized coefficients
are computed via the delta method (as in lavaan::standardizedsolution).
When standardized_se = "bootstrap", CIs for standardized coefficients are
obtained from the bootstrap distribution of the standardized statistic
(std.all) returned by lavaan::parameterEstimates with standardized = TRUE.
In this case, lavaan reports SE for the corresponding unstandardized parameter;
a bootstrap SE for standardized coefficients is not provided by lavaan.
lavaanExtra preserves this behavior and labels the SE source in the output.
The default standardized_se = "model" chooses "bootstrap" if the fitted
model used se = "bootstrap" (and bootstrap > 0), and "delta" otherwise.
Usage
lavaan_extract(
  fit,
  operator = NULL,
  lhs_name = "Left-Hand Side",
  rhs_name = "Right-Hand Side",
  underscores_to_symbol = "→",
  diag = NULL,
  standardized_se = "model",
  nice_table = FALSE,
  ...
)
Arguments
fit |
lavaan fit object to extract fit indices from |
operator |
Which operator to subselect with. |
lhs_name |
Name of first column, referring to the left-hand side expression (lhs). |
rhs_name |
Name of first column, referring to the right-hand side expression (rhs). |
underscores_to_symbol |
Character to convert underscores to arrows in the first column, like for indirect effects. Default to the right arrow symbol, but can be set to NULL or "_", or to any other desired symbol. It is also possible to provide a vector of replacements if they they are not all the same. |
diag |
When extracting covariances ( |
standardized_se |
Character string indicating the method to use for
computing standard errors and confidence intervals of standardized estimates.
Options are "model" (default, auto-detects based on model fitting method),
"delta" (uses delta method via lavaan::standardizedsolution), or
"bootstrap" (uses bootstrap method via lavaan::parameterEstimates with
|
nice_table |
Logical, whether to print the table as a rempsyc::nice_table as well as print the reference values at the bottom of the table. |
... |
Arguments to be passed to rempsyc::nice_table |
Value
A dataframe, including the indirect effect ("lhs"),
corresponding paths ("rhs"), standardized regression
coefficient ("std.all"), corresponding p-value, as well
as the unstandardized regression coefficient ("est") and
its confidence interval ("ci.lower", "ci.upper"). When
standardized_se = "delta", standardized SE and CI
are computed using the delta method. When standardized_se = "bootstrap", standardized CI are computed using bootstrap
and SE represents the unstandardized bootstrap SE (lavaan
limitation). The SE computation method is stored as an
attribute (standardized_se_method) for verification.
Examples
x <- paste0("x", 1:9)
(latent <- list(
  visual = x[1:3],
  textual = x[4:6],
  speed = x[7:9]
))

(mediation <- list(
  speed = "visual",
  textual = "visual",
  visual = c("ageyr", "grade")
))

(indirect <- list(
  IV = c("ageyr", "grade"),
  M = "visual",
  DV = c("speed", "textual")
))

HS.model <- write_lavaan(mediation,
  indirect = indirect,
  latent = latent, label = TRUE
)
cat(HS.model)

library(lavaan)
fit <- sem(HS.model, data = HolzingerSwineford1939)
lavaan_extract(fit, lhs_name = "Indirect Effect", operator = ":=")
Extract relevant regression indices from lavaan model
Description
Extract relevant regression indices from lavaan model through lavaan::parameterEstimates and lavaan::standardizedsolution.
Uncertainty for standardized coefficients: When standardized_se = "delta",
standard errors (SE) and confidence intervals (CI) for standardized coefficients
are computed via the delta method (as in lavaan::standardizedsolution).
When standardized_se = "bootstrap", CIs for standardized coefficients are
obtained from the bootstrap distribution of the standardized statistic
(std.all) returned by lavaan::parameterEstimates with standardized = TRUE.
In this case, lavaan reports SE for the corresponding unstandardized parameter;
a bootstrap SE for standardized coefficients is not provided by lavaan.
lavaanExtra preserves this behavior and labels the SE source in the output.
The default standardized_se = "model" chooses "bootstrap" if the fitted
model used se = "bootstrap" (and bootstrap > 0), and "delta" otherwise.
Usage
lavaan_reg(fit, standardized_se = "model", nice_table = FALSE, ...)
Arguments
fit |
lavaan fit object to extract fit indices from |
standardized_se |
Character string indicating the method to use for
computing standard errors and confidence intervals of standardized estimates.
Options are "model" (default, auto-detects based on model fitting method),
"delta" (uses delta method via lavaan::standardizedsolution), or
"bootstrap" (uses bootstrap method via lavaan::parameterEstimates with
|
nice_table |
Logical, whether to print the table as a rempsyc::nice_table as well as print the reference values at the bottom of the table. |
... |
Arguments to be passed to rempsyc::nice_table |
Value
A dataframe, including the outcome ("lhs"), predictor ("rhs"),
standardized regression coefficient ("std.all"), corresponding
p-value, as well as the unstandardized regression coefficient
("est") and its confidence interval ("ci.lower", "ci.upper").
When standardized_se = "delta", standardized SE and CI
are computed using the delta method. When standardized_se = "bootstrap", standardized CI are computed using bootstrap
and SE represents the unstandardized bootstrap SE (lavaan
limitation). The SE computation method is stored as an
attribute (standardized_se_method) for verification.
Examples
x <- paste0("x", 1:9)
(latent <- list(
  visual = x[1:3],
  textual = x[4:6],
  speed = x[7:9]
))

(regression <- list(
  ageyr = c("visual", "textual", "speed"),
  grade = c("visual", "textual", "speed")
))

HS.model <- write_lavaan(latent = latent, regression = regression)
cat(HS.model)

library(lavaan)
fit <- sem(HS.model, data = HolzingerSwineford1939)
lavaan_reg(fit)
Extract relevant variance indices from lavaan model
Description
Extract relevant variance indices from lavaan
model through lavaan::parameterEstimates (when estimate = "sigma",
est column)) or lavaan::standardizedsolution (when estimate = "r2",
est.std column). R2 values are then calculated as 1 - est.std, and
the new p values for the R2, with the following formula:
stats::pnorm((1 - est) / se).
Usage
lavaan_var(fit, estimate = "r2", nice_table = FALSE, ...)
Arguments
fit |
lavaan fit object to extract covariance indices from |
estimate |
What estimate to use, either the standardized estimate ("r2", default), or unstandardized estimate ("sigma2"). |
nice_table |
Logical, whether to print the table as a rempsyc::nice_table as well as print the reference values at the bottom of the table. |
... |
Arguments to be passed to rempsyc::nice_table |
Value
A dataframe of covariances/correlation, including the covaried variables, the covariance/correlation, and corresponding p-value.
Examples
x <- paste0("x", 1:9)
(latent <- list(
  visual = x[1:3],
  textual = x[4:6],
  speed = x[7:9]
))

(regression <- list(
  ageyr = c("visual", "textual", "speed"),
  grade = c("visual", "textual", "speed")
))

(covariance <- list(speed = "textual", ageyr = "grade"))

HS.model <- write_lavaan(
  regression = regression, covariance = covariance,
  latent = latent, label = TRUE
)
cat(HS.model)

library(lavaan)
fit <- sem(HS.model, data = HolzingerSwineford1939)
lavaan_var(fit)
Extract relevant fit indices from lavaan model
Description
Compares fit from one or several lavaan models. Also optionally includes references values. The reference fit values are based on Schreiber (2017), Table 3.
Usage
nice_fit(
  model,
  model.labels,
  nice_table = FALSE,
  guidelines = TRUE,
  stars = FALSE,
  verbose = TRUE
)
Arguments
model |
lavaan model object(s) to extract fit indices from |
model.labels |
Model labels to use. If a named list is provided
for |
nice_table |
Logical, whether to print the table as a rempsyc::nice_table. |
guidelines |
Logical, if |
stars |
Logical, if |
verbose |
Logical, whether to display messages and warnings. |
Details
Note that nice_fit reports the unbiased SRMR through
lavaan::lavResiduals() because the standard SRMR is upwardly
biased (doi:10.1007/s11336-016-9552-7) in a noticeable
way for smaller samples (thanks to James Uanhoro for this change).
If using guidelines = TRUE, please carefully consider the following 2023
quote from Terrence D. Jorgensen:
I do not recommend including cutoffs in the table, as doing so would perpetuate their misuse. Fit indices are not test statistics, and their suggested cutoffs are not critical values associated with known Type I error rates. Numerous simulation studies have shown how poorly cutoffs perform in model selection (e.g., , Jorgensen et al. (2018). Instead of test statistics, fit indices were designed to be measures of effect size (practical significance), which complement the chi-squared test of statistical significance. The range of RMSEA interpretations above is more reminiscent of the range of small/medium/large effect sizes proposed by Cohen for use in power analyses, which are as arbitrary as alpha levels, but at least they better respect the idea that (mis)fit is a matter of magnitude, not nearly so simple as "perfect or imperfect."
Value
A dataframe, representing select fit indices (chi2, df, chi2/df, p-value of the chi2 test, CFI, TLI, RMSEA and its 90% CI, unbiased SRMR, AIC, and BIC).
References
Schreiber, J. B. (2017). Update to core reporting practices in structural equation modeling. Research in social and administrative pharmacy, 13(3), 634-643. doi:10.1016/j.sapharm.2016.06.006
Examples
x <- paste0("x", 1:9)
(latent <- list(
  visual = x[1:3],
  textual = x[4:6],
  speed = x[7:9]
))

(regression <- list(
  ageyr = c("visual", "textual", "speed"),
  grade = c("visual", "textual", "speed")
))

HS.model <- write_lavaan(latent = latent, regression = regression)
cat(HS.model)

library(lavaan)
fit <- sem(HS.model, data = HolzingerSwineford1939)
nice_fit(fit)
Make a quick lavaanPlot
Description
Make a quick and decent-looking lavaanPlot.
Usage
nice_lavaanPlot(
  model,
  node_options = list(shape = "box", fontname = "Helvetica"),
  edge_options = c(color = "black"),
  coefs = TRUE,
  stand = TRUE,
  covs = FALSE,
  stars = c("regress", "latent", "covs"),
  sig = 0.05,
  graph_options = c(rankdir = "LR"),
  ...
)
Arguments
model |
SEM or CFA model to plot. |
node_options |
Shape and font name. |
edge_options |
Colour of edges. |
coefs |
Logical, whether to plot coefficients. Defaults to TRUE. |
stand |
Logical, whether to use standardized coefficients. Defaults to TRUE. |
covs |
Logical, whether to plot covariances. Defaults to FALSE. |
stars |
Which links to plot significance stars for. One of
|
sig |
Which significance threshold to use to plot coefficients (defaults
to .05). To plot all coefficients, set |
graph_options |
Read from left to right, rather than from top to bottom. |
... |
Arguments to be passed to function lavaanPlot::lavaanPlot. |
Value
A lavaanPlot, of classes c("grViz", "htmlwidget"), representing the
specified lavaan model.
Illustrations
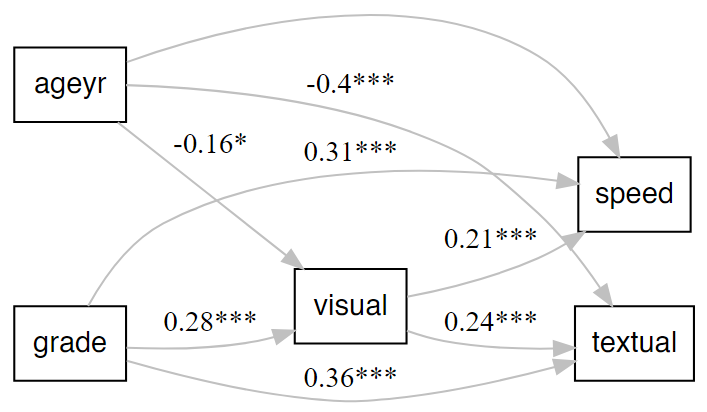
Examples
x <- paste0("x", 1:9)
(latent <- list(
  visual = x[1:3],
  textual = x[4:6],
  speed = x[7:9]
))

HS.model <- write_lavaan(latent = latent)
cat(HS.model)

library(lavaan)
fit <- cfa(HS.model, HolzingerSwineford1939)
nice_lavaanPlot(fit)
Extract relevant modification indices along item labels
Description
Extract relevant modification indices along item labels, with a similarity score provided to help guide decision-making for removing redundant items with high covariance.
Usage
nice_modindices(fit, labels = NULL, method = "lcs", sort = TRUE, ...)
Arguments
fit |
lavaan fit object to extract modification indices from |
labels |
Dataframe of labels. If the original data frame is provided, and that it contains labelled variables, will automatically attempt to extract the correct labels from the dataframe. |
method |
Method for distance calculation from
stringdist::stringsim. Defaults to |
sort |
Logical. If TRUE, sort the output using the values of
the modification index values. Higher values appear first.
Defaults to |
... |
Arguments to be passed to lavaan::modindices |
Value
A dataframe, including the outcome ("lhs"), predictor ("rhs"), standardized regression coefficient ("std.all"), corresponding p-value, as well as the unstandardized regression coefficient ("est") and its confidence interval ("ci.lower", "ci.upper").
Examples
x <- paste0("x", 1:9)
(latent <- list(
  visual = x[1:3],
  textual = x[4:6],
  speed = x[7:9]
))

(regression <- list(
  ageyr = c("visual", "textual", "speed"),
  grade = c("visual", "textual", "speed")
))

HS.model <- write_lavaan(latent = latent, regression = regression)
cat(HS.model)

library(lavaan)
fit <- sem(HS.model, data = HolzingerSwineford1939)
nice_modindices(fit, maximum.number = 5)
data_labels <- data.frame(
  x1 = "I have good visual perception",
  x2 = "I have good cube perception",
  x3 = "I have good at lozenge perception",
  x4 = "I have paragraph comprehension",
  x5 = "I am good at sentence completion",
  x6 = "I excel at finding the meaning of words",
  x7 = "I am quick at doing mental additions",
  x8 = "I am quick at counting dots",
  x9 = "I am quick at discriminating straight and curved capitals"
)
nice_modindices(fit, maximum.number = 10, labels = data_labels, op = "~~")

x <- HolzingerSwineford1939
x <- sjlabelled::set_label(x, label = c(rep("", 6), data_labels))
fit <- sem(HS.model, data = x)
nice_modindices(fit, maximum.number = 10, op = "~~")
Make a quick tidySEM plot
Description
Make a quick and decent-looking tidySEM plot.
Usage
nice_tidySEM(
  fit,
  layout = NULL,
  hide_nonsig_edges = FALSE,
  hide_var = TRUE,
  hide_cov = FALSE,
  hide_mean = TRUE,
  est_std = TRUE,
  label,
  label_location = NULL,
  reduce_items = NULL,
  plot = TRUE,
  ...
)
Arguments
fit |
SEM or CFA model fit to plot. |
layout |
A matrix (or data.frame) that describes the structure; see
tidySEM::get_layout. If a named list is provided,
with names "IV" (independent variables), "M" (mediator), and
"DV" (dependent variables), |
hide_nonsig_edges |
Logical, hides non-significant edges. Defaults to FALSE. |
hide_var |
Logical, hides variances. Defaults to TRUE. |
hide_cov |
Logical, hides co-variances. Defaults to FALSE. |
hide_mean |
Logical, hides means/node labels. Defaults to TRUE. |
est_std |
Logical, whether to use the standardized coefficients. Defaults to TRUE. |
label |
Labels to be used on the plot. As elsewhere in
|
label_location |
Location of label along the path, as a percentage (defaults to middle, 0.5). |
reduce_items |
A numeric vector of length 1 (x) or 2 (x & y) defining
how much space to trim from the nodes (boxes) of the
items defining the latent variables. Can be provided
either as |
plot |
Logical, whether to plot the result (default). If |
... |
Arguments to be passed to tidySEM::prepare_graph. |
Value
A tidySEM plot, of class ggplot, representing the specified
lavaan model.
Illustrations
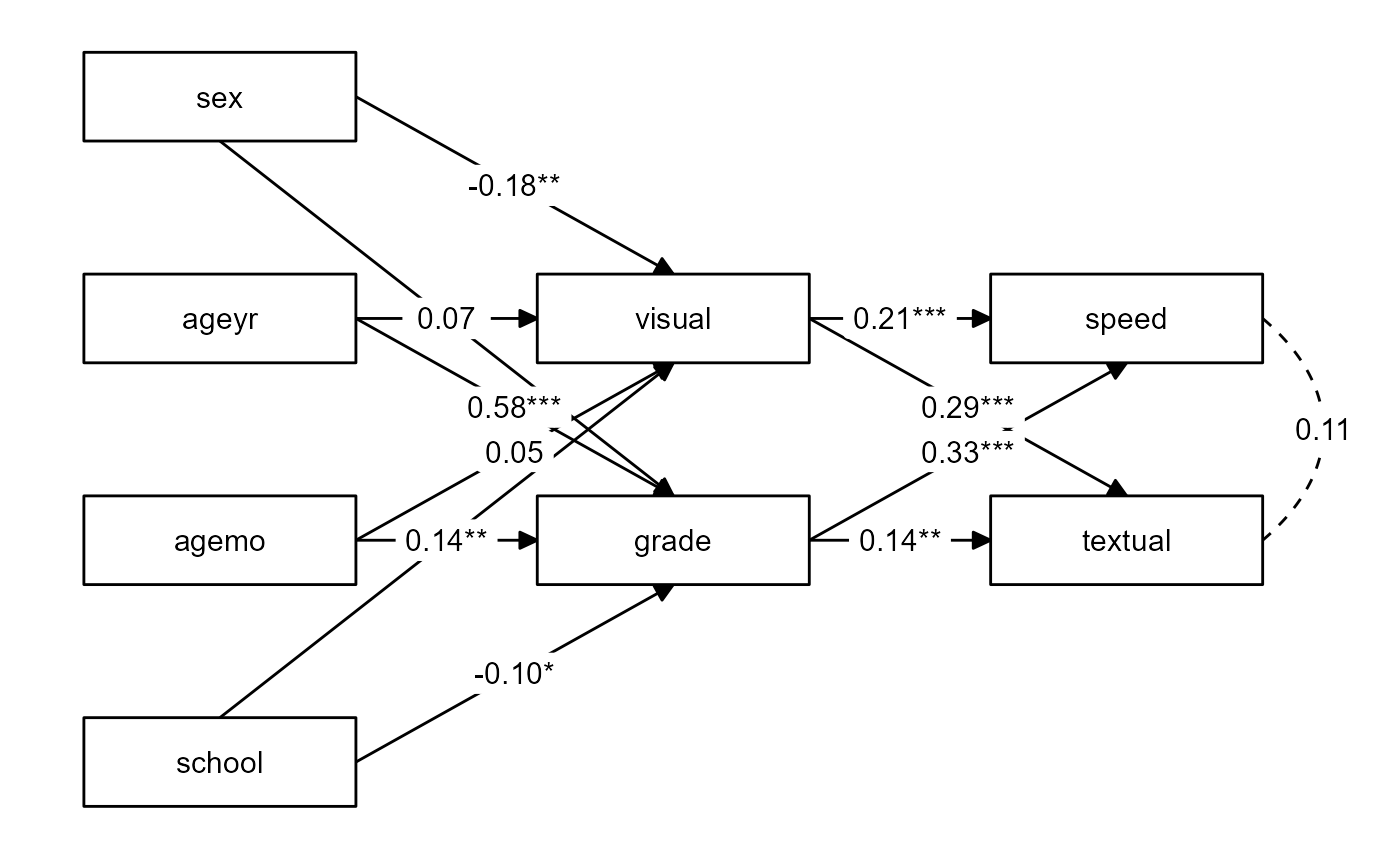
Examples
# Calculate scale averages
library(lavaan)
data <- HolzingerSwineford1939
data$visual <- rowMeans(data[paste0("x", 1:3)])
data$textual <- rowMeans(data[paste0("x", 4:6)])
data$speed <- rowMeans(data[paste0("x", 7:9)])

# Define our variables
IV <- c("sex", "ageyr", "agemo", "school")
M <- c("visual", "grade")
DV <- c("speed", "textual")

# Define our lavaan lists
mediation <- list(speed = M, textual = M, visual = IV, grade = IV)

# Define indirect object
structure <- list(IV = IV, M = M, DV = DV)

# Write the model, and check it
model <- write_lavaan(mediation, indirect = structure, label = TRUE)
cat(model)

# Fit model
fit <- sem(model, data)

# Plot model

nice_tidySEM(fit, layout = structure)
Vector-based lavaan syntax interpreter
Description
Vector-based lavaan syntax interpreter.
Usage
write_lavaan(
  mediation = NULL,
  regression = NULL,
  covariance = NULL,
  indirect = NULL,
  latent = NULL,
  intercept = NULL,
  threshold = NULL,
  constraint.equal = NULL,
  constraint.smaller = NULL,
  constraint.larger = NULL,
  custom = NULL,
  label = FALSE,
  use.letters = FALSE
)
Arguments
mediation |
Mediation indicators ( |
regression |
Regression indicators ( |
covariance |
(Residual) (co)variance indicators ( |
indirect |
Indirect effect indicators ( |
latent |
Latent variable indicators ( |
intercept |
Intercept indicators ( |
threshold |
Threshold indicators ( |
constraint.equal |
Equality indicators ( |
constraint.smaller |
Smaller than indicators ( |
constraint.larger |
Greater than indicators ( |
custom |
Custom specifications. Takes a single string just
like regular |
label |
Logical, whether to display path names for the mediation argument. |
use.letters |
Logical, for the labels, whether to use letters instead of the variable names. |
Value
A character string, representing the specified lavaan model.
See Also
The corresponding vignette: https://lavaanextra.remi-theriault.com/articles/write_lavaan.html
Examples
x <- paste0("x", 1:9)
(latent <- list(
  visual = x[1:3],
  textual = x[4:6],
  speed = x[7:9]
))

HS.model <- write_lavaan(latent = latent)
cat(HS.model)

library(lavaan)
fit <- lavaan(HS.model,
  data = HolzingerSwineford1939,
  auto.var = TRUE, auto.fix.first = TRUE,
  auto.cov.lv.x = TRUE
)
summary(fit, fit.measures = TRUE)