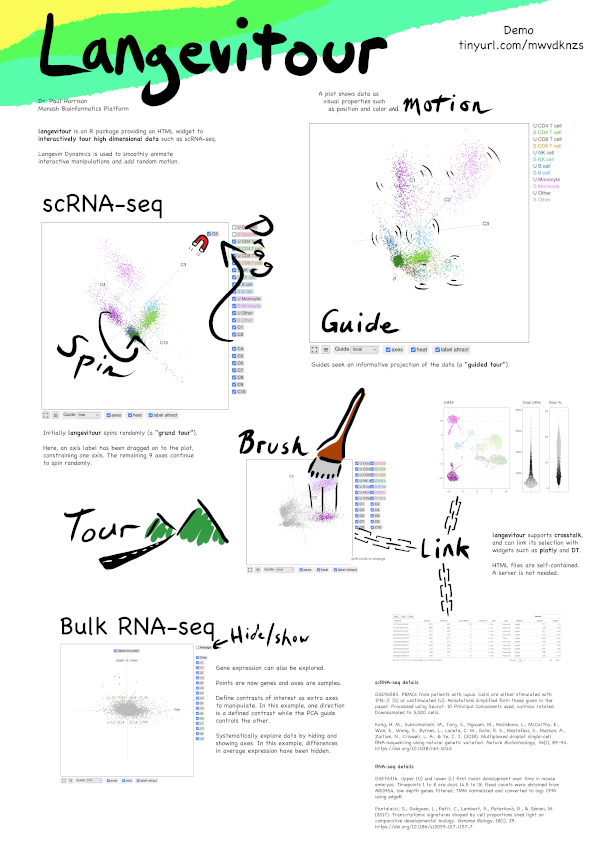
langevitour is an HTML widget that randomly tours projections of a high-dimensional dataset with an animated scatter-plot. The user can manipulate the plot to use specified axes, or turn on Guided Tour mode to perform projection pursuit, finding an informative projection of the data. Groups within the data can be hidden or shown, as can particular axes. Known projections of interest can be added as “extra axes” and also manipulated. The widget can be used from within R or Python, or included in a self-contained Rmarkdown document, or a Shiny app, or used directly from Javascript.
langevitour is a twist on the “tour” concept from software such as XGobi, GGobi, tourr, ferrn, liminal, detourr, spinifex, and loon.tour. The new element in langevitour is the use of Langevin Dynamics to generate the sequence of projections.
langevitour is described in:
Harrison, Paul. 2023. “langevitour: Smooth Interactive Touring of High Dimensions, Demonstrated with scRNA-Seq Data.” The R Journal 15 (2): 206–219. https://doi.org/10.32614/RJ-2023-046.
Further material:
ABACBS Conference 2022 poster (large image) and demo
ABACBS Seminar 2022 slides
useR! 2022 conference slides and video (extended edition)
IASC-ARS 2023 slides and short video for Visualising high-dimensional genomics data: what Non-Linear Dimension Reduction hides and misrepresents. Demonstrates some advanced tricks setting the state of the widget using buttons in a Quarto presentation.
Release version:
install.packages("langevitour")Development version:
remotes::install_github("pfh/langevitour")To build the documentation site:
install.packages(c("devtools", "pkgdown", "BiocManager"))
devtools::install_dev_deps()
BiocManager::install(c("airway", "org.Hs.eg.db", "edgeR", "limma"))

pkgdown::build_site()Example:
library(langevitour)

data(zeiselPC)
langevitour(zeiselPC[,-1], zeiselPC$type)The minified and bundled version can be found in
inst/htmlwidgets/lib/langevitour-pack.js.
If using node and npm
for development, langevitour can be added with:
npm install langevitourThis provides the widget as a modern ESM module. In your HTML page you can import it with:
<script type="module">

import { Langevitour } from "langevitour";

// ...
</script>
You’ll need to use a packager such as parcel or webpack to use this. Please tell me if you run into any problems, I am fairly new to Javascript development.
To avoid using npm, you could use skypack.dev. You will still need to
serve your page with some sort of web-server, such as
python3 -m http.server.
<script type="module">

import { Langevitour } from "https://cdn.skypack.dev/langevitour";

// ...
</script>
Here is an example using skypack in an Observable Notebook.
langevitour is written in TypeScript, which is compiled to JavaScipt,
and then Webpack is used to produce a minified and bundled version. To
make changes to the JavaScript side of langevitour, you will need to
install node, which includes the
npm package manager. npm can then install the
necessary build tools and dependencies. Build scripts are defined in
package.json and used as below.
git clone https://github.com/pfh/langevitour.git
cd langevitour

# Install required packages
npm install

# ... edit source in src/ directory ...

# Compile TypeScript modules in src/ to JavaScript modules in lib/.
# Produce minified bundle inst/htmlwidgets/lib/langevitour.js
npm run js-build

# Complete Javascript+R build and documentation process.
npm run build
For example, to define a new guide you would:
ts/guides.ts.gradTable in
ts/guides.ts.guideSelect select box in
ts/langevitour.ts.npm run js-build and the new guide should appear
when you load example.html.pip install langevitourimport numpy as np
from langevitour import Langevitour
# Generate a sample dataset
X = []
group = []
n = 20000
def r():
return np.random.normal(0, 0.02)
for i in range(n):
a = i/n * np.pi * 2
X.append([
10 + np.sin(a)/3 + r(),
20 + np.sin(a*2)/3 + r(),
30 + np.sin(a*3)/3,
40 + np.sin(a*4)/3,
50 + np.sin(a*5)/3
])
group.append(int(i*4/n))
# Extra axes (specified as columns of a matrix)
extra_axes = [[1], [2], [0], [0], [0]]
extra_axes_names = ["V1+2*V2"]
tour = Langevitour(
X,
group=group,
extra_axes=extra_axes,
extra_axes_names=extra_axes_names,
point_size=1,
)
tour.write_html("langevitour_plot.html")langevitour also works in jupyter notebooks.
The Javascript and R package are written by Paul Harrison. The Python package was kindly contributed by Wytamma Wirth.
Langevitour is free software made available under the MIT license. Included libraries jStat and SVD-JS are also provided under the MIT license. Included library D3 is provided under the ISC license.