




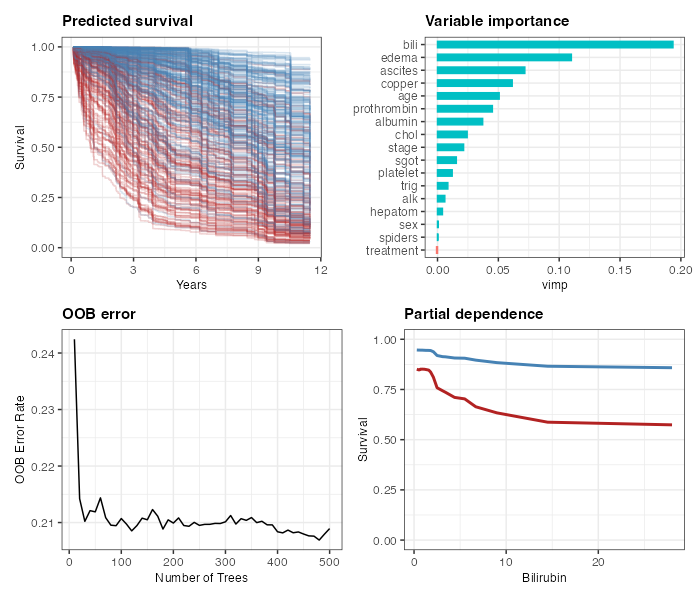
ggRandomForests provides ggplot2-based
diagnostic and exploration plots for random forests fit with randomForestSRC
(>= 3.4.0) or randomForest.
It keeps the data step apart from the figure step, so you can inspect,
save, or reuse the tidy object on its own.
It also covers varPro (>=
3.1.0), which reaches the same questions by a different route: variable
selection built from rules rather than permutation, importance for one
observation rather than the whole fit, and dependency and signal
detection on unsupervised fits. Eight of the nineteen gg_*
families read a varPro object.
Listed in the ggplot2 extensions gallery.
# CRAN (stable)
install.packages("ggRandomForests")

# Development version from GitHub
# install.packages("remotes")
remotes::install_github("ehrlinger/ggRandomForests")library(randomForestSRC)
library(ggRandomForests)
# 1. Fit a forest (regression)
rf <- rfsrc(medv ~ ., data = MASS::Boston, importance = TRUE)
# 2. Check convergence: did the forest grow enough trees?
plot(gg_error(rf))
# 3. Rank predictors by importance
plot(gg_vimp(rf))
# 4. Marginal dependence for top variables
gg_v <- gg_variable(rf)
plot(gg_v, xvar = "lstat")
plot(gg_v, xvar = rf$xvar.names, panel = TRUE, se = FALSE)
# 5. Partial dependence for a single predictor
pv <- plot.variable(rf, xvar.names = "lstat", partial = TRUE, show.plots = FALSE)
pd <- gg_partial(pv)
plot(pd)For survival forests, see the package vignette:
vignette("ggRandomForests")For variable importance with varPro — partial dependence, importance z-scores, beta importance, individual/local importance, and isolation forests — see the dedicated vignette:
vignette("varpro", package = "ggRandomForests")The unsupervised varPro tools — gg_udependent(),
gg_beta_uvarpro(), and gg_sdependent(), which
read structure off a uvarpro() fit with no outcome — have
their own short vignette:
vignette("uvarpro", package = "ggRandomForests")Grouped by what you are trying to look at. The first column is the function you call, the second is what you hand it.
| Function | Input | What you get |
|---|---|---|
gg_error() |
rfsrc / randomForest |
OOB error vs. number of trees |
gg_vimp() |
rfsrc / randomForest |
Variable importance ranking |
gg_rfsrc() |
rfsrc / randomForest |
Predicted vs. observed values |
gg_variable() |
rfsrc / randomForest |
Marginal dependence data frame |
| Function | Input | What you get |
|---|---|---|
gg_partial() |
plot.variable output |
Partial dependence (continuous + categorical) |
gg_partial_rfsrc() |
rfsrc model |
Partial dependence via partial.rfsrc |
surv_partial.rfsrc() |
rfsrc survival forest |
Survival partial dependence, one or more predictors |
quantile_pts() |
numeric vector | Quantile cut points for coplot panels |
| Function | Input | What you get |
|---|---|---|
gg_survival() |
rfsrc survival forest, or a data frame |
Kaplan–Meier / Nelson–Aalen estimates |
gg_brier() |
rfsrc (survival) |
Time-resolved Brier score and CRPS |
kaplan() |
data frame + interval/censor columns | Nonparametric Kaplan–Meier estimate |
nelson() |
data frame + interval/censor columns | Nonparametric Nelson–Aalen estimate |
| Function | Input | What you get |
|---|---|---|
gg_roc() |
rfsrc / randomForest (class) |
ROC curve data |
calc_roc() |
rfsrc / randomForest (class) |
The sensitivity/specificity sweep behind gg_roc() |
calc_auc() |
gg_roc object |
Area under the curve |
These read a varPro fit rather than a forest.
varpro() is the supervised fit; uvarpro() is
the unsupervised one, which needs no outcome.
| Function | Input | What you get |
|---|---|---|
gg_varpro() |
varpro fit |
Release-rule variable importance |
gg_beta_varpro() |
varpro fit |
Per-variable lasso-beta importance |
gg_ivarpro() |
varpro fit |
Individual (local) variable importance |
gg_partial_varpro() |
varpro fit |
Partial dependence (alias: gg_partialpro()) |
gg_isopro() |
isopro fit |
Isolation-forest anomaly scores |
gg_udependent() |
uvarpro fit |
Variable dependency graph |
gg_beta_uvarpro() |
uvarpro fit |
Per-variable lasso-beta importance |
gg_sdependent() |
uvarpro fit |
Signal-variable detection |
varpro_feature_names() |
character vector | Original names behind one-hot encoded features |
| Function | Input | What you get |
|---|---|---|
gg_shap() |
rfsrc / randomForest |
Shapley additive explanation values |
shap_importance() |
gg_shap object |
Global importance bar chart |
shap_beeswarm() |
gg_shap object |
Beeswarm summary plot |
shap_dependence() |
gg_shap object |
Dependence plot for one predictor |
Each gg_* function has a matching plot() S3
method that hands back a single plottable object: a ggplot
you extend with +, or a patchwork composite
for the multi-panel methods. Every gg_* object also has
print() and summary() methods:
print() shows a short header at the REPL rather than
dumping every row (use head() when you want the rows), and
summary() gives you a diagnostics object you can print or
keep.
The package is built on one decision: keep the data step and the
figure step apart. The gg_* functions pull a tidy data
object out of the forest; the plot() methods turn that
object into a ggplot2 figure. Two things follow from that
split.
First, the data object stands on its own. It carries everything its plot needs, so you can save it, inspect it, or come back to it later without keeping the original forest — which can be large — in memory.
Second, you are never locked into the default figure. Because a
plot() method returns a single plottable object (a
ggplot, or a patchwork composite for the
multi-panel methods), you can add layers, swap scales, or apply a theme;
and if the default is not what you want, you can ignore it entirely and
build the figure from the tidy data yourself.
See NEWS.md for the full changelog. Recent highlights:
gg_roc() on an
rfsrc forest now honors the documented
which_outcome = 0, which had been returning an unusable
two-row object; gg_partial_rfsrc() rejects a non-forest
with a real error instead of “argument is of length zero”. Also a
test-only fix for the gcc-UBSAN report filed against
3.5.0.plot.gg_varpro()
no longer draws a phantom “NA” category,
gg_partial_varpro() warns when you name a variable the fit
cannot reach, and scale = "chf" now honors
xvar.names instead of computing every variable. Vignette
figures render with ragg, which cut the source tarball from
4.7 MB to 2.3 MB.gg_beta_uvarpro(), gg_sdependent()) with
their own vignette; gg_partial_rfsrc() now handles factor
predictors correctly.Breiman, L. (2001). Random forests, Machine Learning, 45:5–32.
Ishwaran H. and Kogalur U.B. randomForestSRC: Random Forests for Survival, Regression and Classification. R package version >= 3.4.0. https://cran.r-project.org/package=randomForestSRC
Ishwaran H. and Kogalur U.B. (2007). Random survival forests for R. R News 7(2), 25–31.
Ishwaran H., Kogalur U.B., Blackstone E.H. and Lauer M.S. (2008). Random survival forests. Ann. Appl. Statist. 2(3), 841–860.
Liaw A. and Wiener M. (2002). Classification and Regression by randomForest. R News 2(3), 18–22.
Wickham H. (2009). ggplot2: Elegant Graphics for Data Analysis. Springer New York.