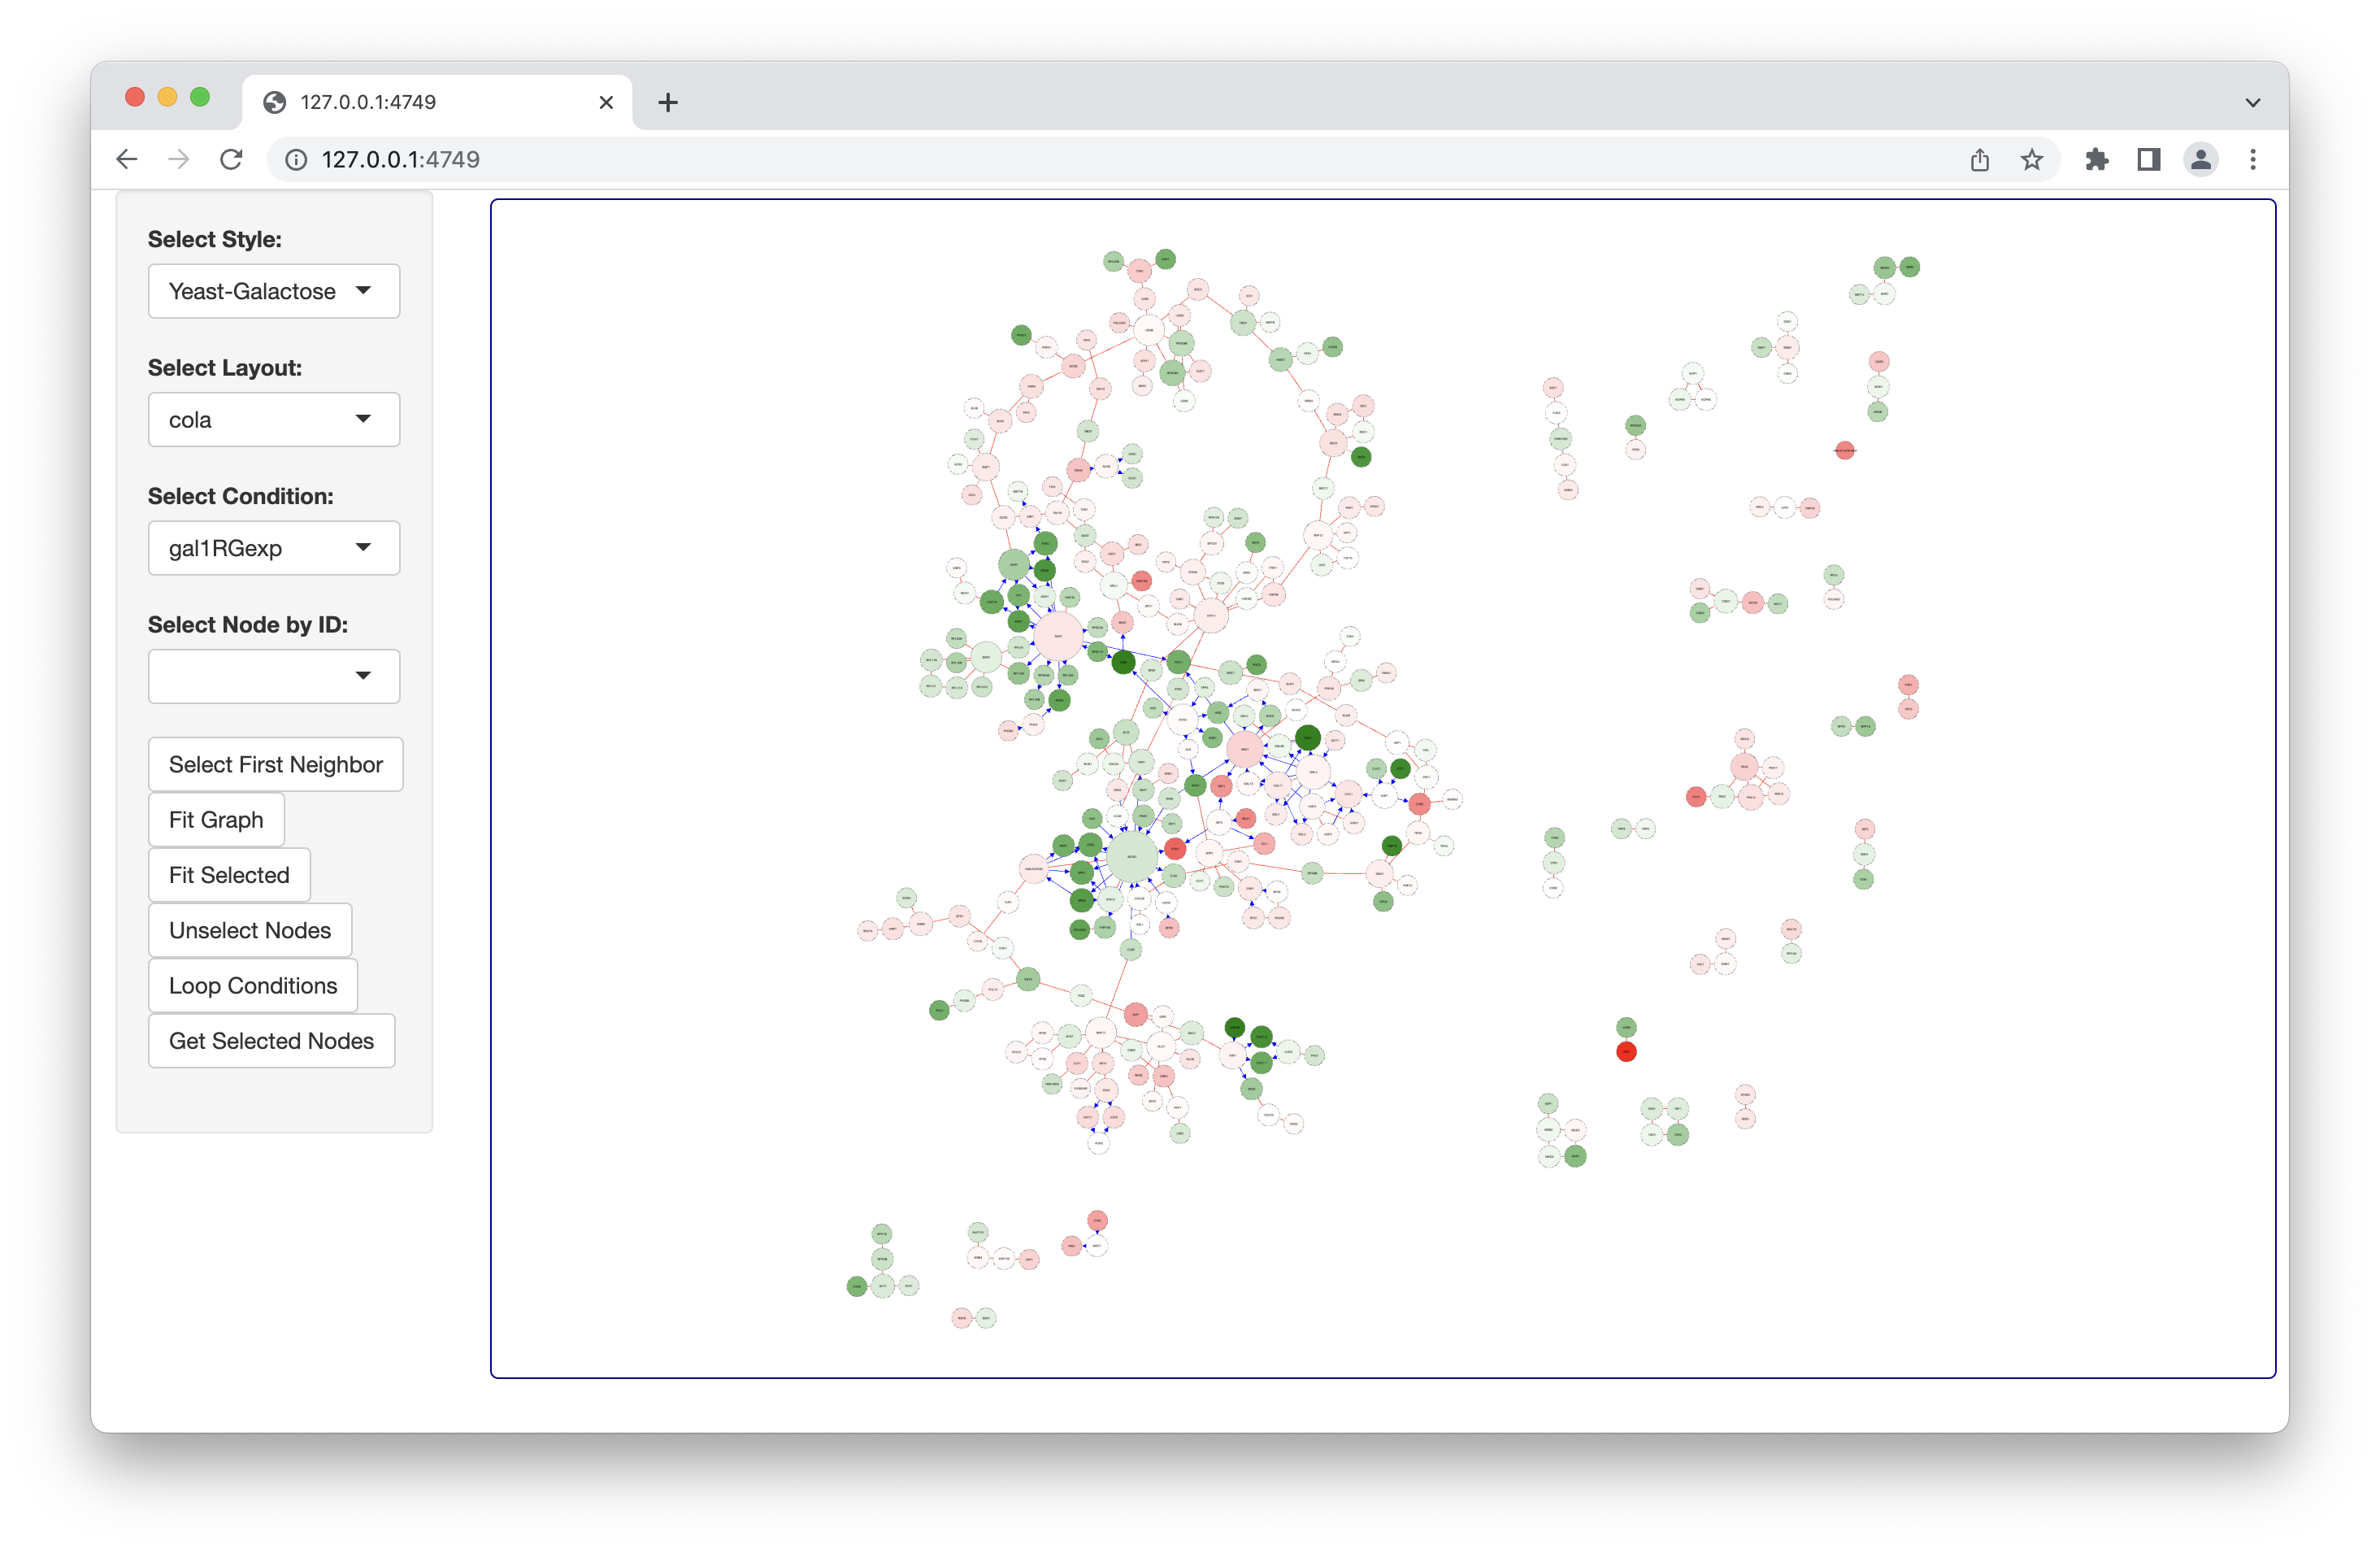
cyjShiny is a Shiny widget based on htmlWidgets for network visualization using cytoscape.js.
Users should start with CRAN as it is the most stable version:
install.packages("cyjShiny") library(remotes)
remotes::install_github(repo="cytoscape/cyjShiny", ref="master", build_vignette=TRUE)Instructions for compiling cytoscape.js for use with htmlWidgets. NOTE: This should only be used by those actively modifying cytoscape.js.
help(package="cyjShiny")
library(shiny)
library(cyjShiny)
library(graph)
library(jsonlite)

# NETWORK DATA ----
tbl_nodes <- data.frame(id=c("A", "B", "C"),
                        size=c(10, 20, 30),
                        stringsAsFactors=FALSE)

# Must have the interaction column
tbl_edges <- data.frame(source=c("A", "B", "C"),
                        target=c("B", "C", "A"),
                        interaction=c("inhibit", "stimulate", "inhibit"),
                        stringsAsFactors=FALSE)

graph_json <- toJSON(dataFramesToJSON(tbl_edges, tbl_nodes), auto_unbox=TRUE)

# UI ----
ui <- fluidPage(cyjShinyOutput('cyjShiny'))

# SERVER ----
server <- function(input, output, session) {
  output$cyjShiny <- renderCyjShiny({
    # Layouts (see js.cytoscape.org): cola, cose, circle, concentric, grid, breadthfirst, random, fcose, spread
    cyjShiny(graph_json, layoutName="cola")
  })
}

# RUN ----
shinyApp(ui=ui, server=server)Many of the visual properties of a network can be stylized.
data() maps data dynamically to
specify a property value from the input data.frame):[
{"selector":"node", "css": {
"border-width": "2px",
"width": "data(size)",
"height": "data(size)",
"content": "data(id)"
}},
{"selector": "edge[interaction='stimulate']", "css": {
"line-color": "green"
}},
{"selector": "edge[interaction='inhibit']", "css": {
"line-color": "red"
}}
]Save the example styling to a file style.js in the
current working directory and replace cyjShiny() in the
Quick Start example as shown below:
cyjShiny(graph_json, layoutName="cola", styleFile="style.js")
