






WISP.data is an R package designed to automate the
download, quality control (QC), processing, analysis, and visualization
of spectral data collected by WISPstation fixed spectroradiometers.
Developed by Water Insight B.V. (Ede, The Netherlands) as an evolution
of the handheld WISP-3 system (Hommersom et al., 2012), the WISPstation
is an autonomous above water instrument installed at fixed position that
records radiance and irradiance across a wavelength range of 350 to 900
nm, with a spectral resolution of 4.6 nm at high frequency (e.g. every
15 minutes, during daytime) (Peters et al., 2018). This R package serves
as a crucial bridge between Water Insight API services and the
scientific users, enabling the conversion of native reflectance
measurements into robust, analysis-ready products through fully
reproducible and transparent workflows, from an Open Science
perspective.
The WISPstation operates with 8 specialized channels to optimize data collection:
The system automatically selects the best-oriented sensor set based on the Sun’s position, maintaining a relative azimuth angle of approximately 135°.
A central function of WISP.data is the retrieval and
management of Remote Sensing Reflectance (Rrs), which the
WISPstation calculates as the ratio between water-leaving radiance
(\(L_w\)) and downwelling irradiance
(\(E_s\)) (Mobley, 1999):
\[\text{Rrs}(\lambda) = \frac{L_w(\lambda)}{E_s(\lambda)} = \frac{L_u(\lambda) - \rho \cdot L_{sky}(\lambda)}{E_s(\lambda)}\]
Where \(\rho\) is the Fresnel reflection coefficient, \(L_u\) is the total upwelling radiance and \(L_{sky}\) is the sky radiance contributing to surface reflections.
The package handles the complex transition from total upwelling radiance (\(L_u\)), which includes unwanted sky-glint and sun-glint, to the pure water-leaving signal (\(L_w\)) by integrating \(L_{sky}\) and \(E_s\) measurements into standardized atmospheric correction algorithms.
WISP.data provides a modular set of R functions for:
This makes WISP.data an ideal solution for operational
water quality monitoring, long-term research applications, and
integration into large-scale environmental data pipelines.
The WISPstation is a fixed spectrometer that plays a crucial role in the continuous monitoring of water quality; beyond providing high-frequency spectral measurements, it delivers specialized water quality products derived through various algorithms (Gons et al., 1997, 2005; Simis, 2005), essential for environmental observation, ecosystem assessment, and long-term trend analysis.
However, the effective management and scientific use of these spectral data and derived products present several significant challenges. Data retrieval through API services is often labor-intensive and technically demanding, especially for users without advanced programming experience. In addition, native spectral measurements could be affected by radiometric issues making the implementation of consistent and rigorous quality control procedures essential. Without rigorous filtering and validation protocols, derived products can be unreliable or scientifically misleading. A further critical barrier lies in the interpretation of spectral signatures themselves. For non-expert users, it is difficult to assess the physical and optical reliability of reflectance spectra, identify anomalous signals, or distinguish between instrument geometry artifacts and real environmental variability. Moreover, the application of third-party bio-optical algorithms for the estimation of water quality parameters typically requires substantial domain knowledge, careful parameterization, and consistent preprocessing workflows, which are rarely standardized across studies.
The scientific validity and operational reliability of WISPstation
measurements have been demonstrated in several studies, ranging from the
detection of climate-driven chlorophyll-a changes during extreme events
(Free et al., 2021) to the analysis of phytoplankton spatio-temporal
dynamics in Lake Trasimeno (Bresciani et al., 2020). Despite these
successful applications, the processing of WISPstation data has been
labor-intensive and time-consuming. Prior to the development of
WISP.data, researchers often had to manually inspect
individual spectral signatures to identify outliers before the data
could be used to estimate water quality parameter. This manual quality
control process is prone to subjectivity and significantly limits the
scalability of high-frequency monitoring.
WISP.data addresses these challenges by delivering an
integrated, transparent, reproducible, and user-oriented software
ecosystem that unifies data acquisition, quality control, and product
generation within a single R-based framework. By lowering technical and
methodological barriers, the package enables both expert and non-expert
users to transform native WISPstation measurements into reliable,
scientifically consistent water quality products, fostering
reproducibility, comparability, and broader adoption of spectral
monitoring technologies in aquatic research and operational
monitoring.
You can install the development version of WISP.data directly from
GitHub.
The following commands will automatically install all required
dependencies:
# Install remotes if not already available
if (!require("remotes")) install.packages("remotes")

# Install WISP.data and dependencies
remotes::install_github("oggioniale/WISP.data", dependencies = TRUE)For a detailed description of each function, please visit Reference page of documentation.
To view a complete example of WISP.data a vignette has created.
A ShinyApp has been created to reproduce some of the package’s
features through a simple user interface. The function WISP_runApp()
can be executed to launch this app.
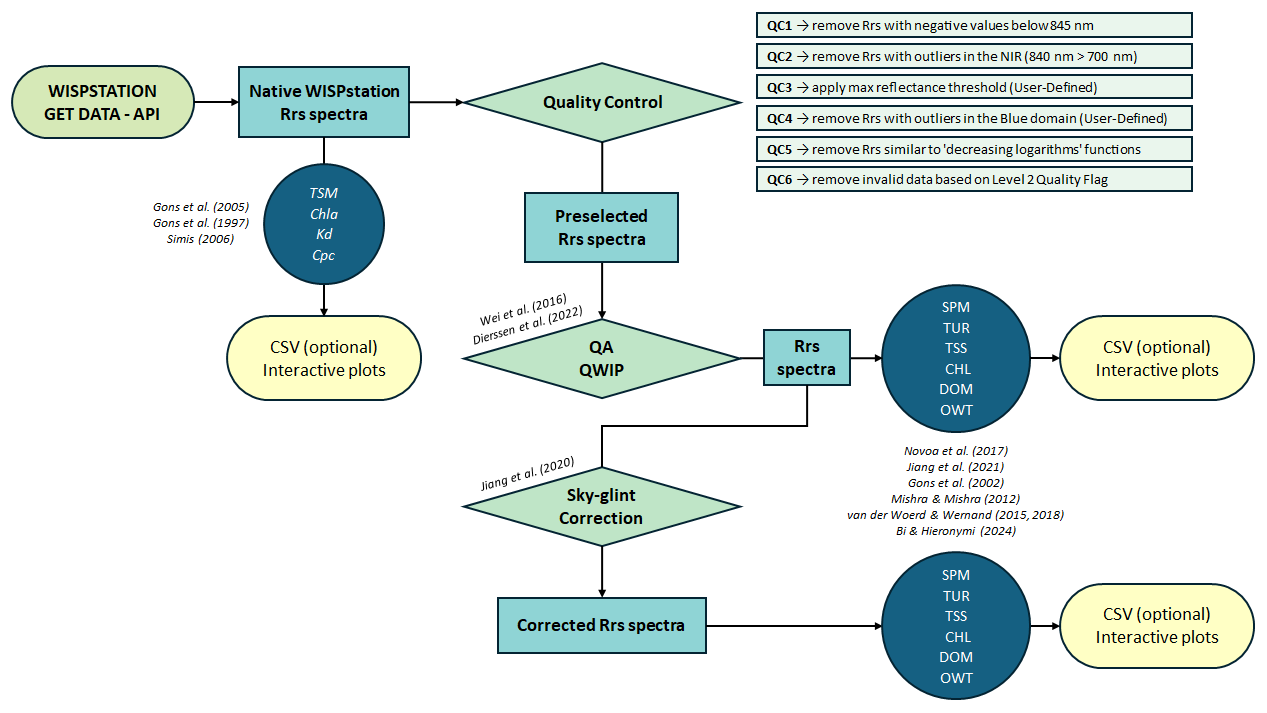
Figure 1. WISP.data workflow.
To cite {WISP.data} please use:
Alessandro Oggioni & Nicola Ghirardi. (2026). WISP.data (v1.0.0). Zenodo. https://doi.org/10.5281/zenodo.16893167
@software{WIPS.data2026,
  title = {WISP.data - Managing WISPstation Hyperspectral Data},
  author = {Alessandro Oggioni and Nicola Ghirardi},
  year = {2026},
  doi = {https://doi.org/10.5281/zenodo.16893167},
  note = {R package version v1.0.0},
}In this section, we showcase some of the typical outputs generated by
WISP.data.
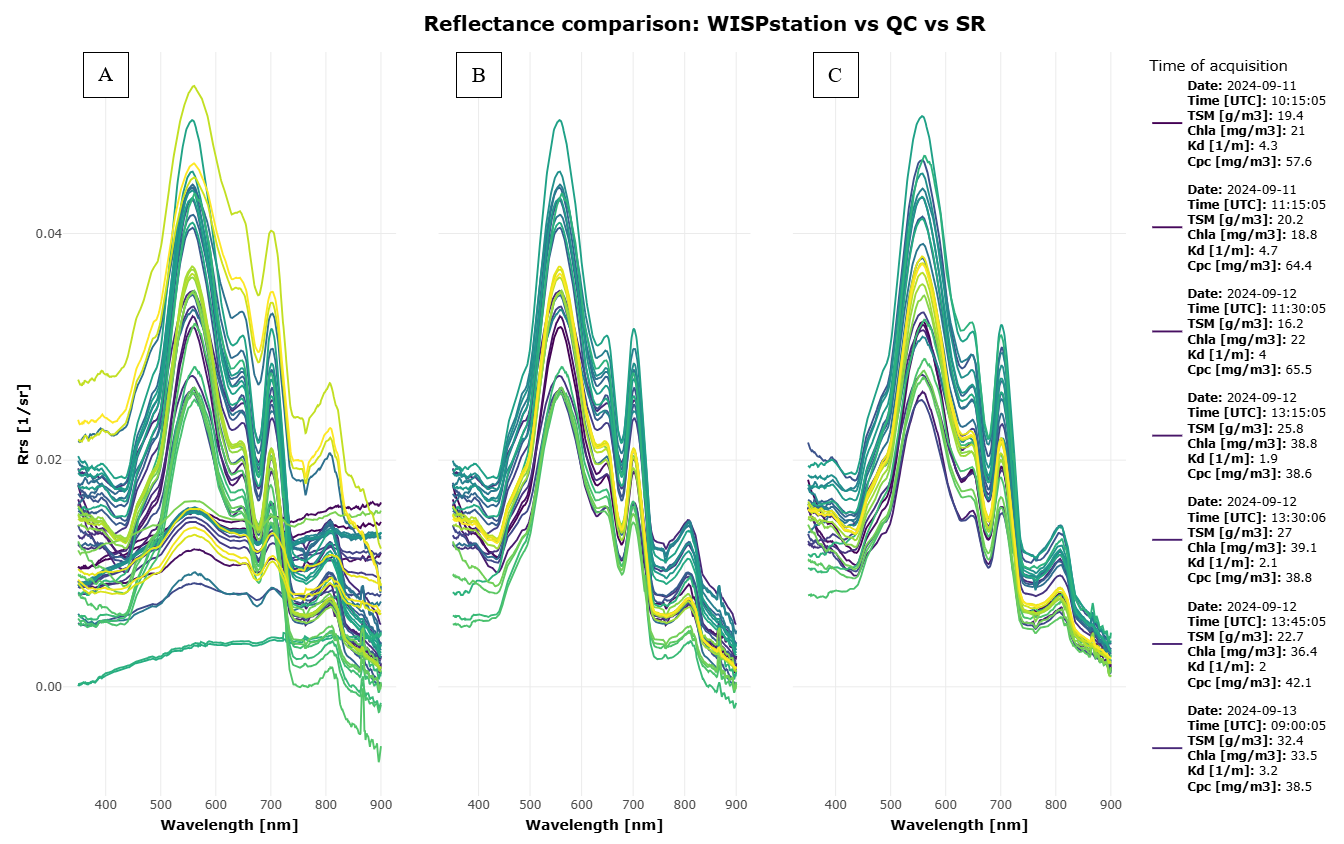
Figure 2. Plot resulting from the
wisp_plot_comparison() function showing the comparison
between: A) native WISPstation Rrs, B) Rrs filtered by “QC”, C) Rrs to
which “SR” has been applied (site: Trasimeno; period: 11/09/2024 –
17/09/2024).
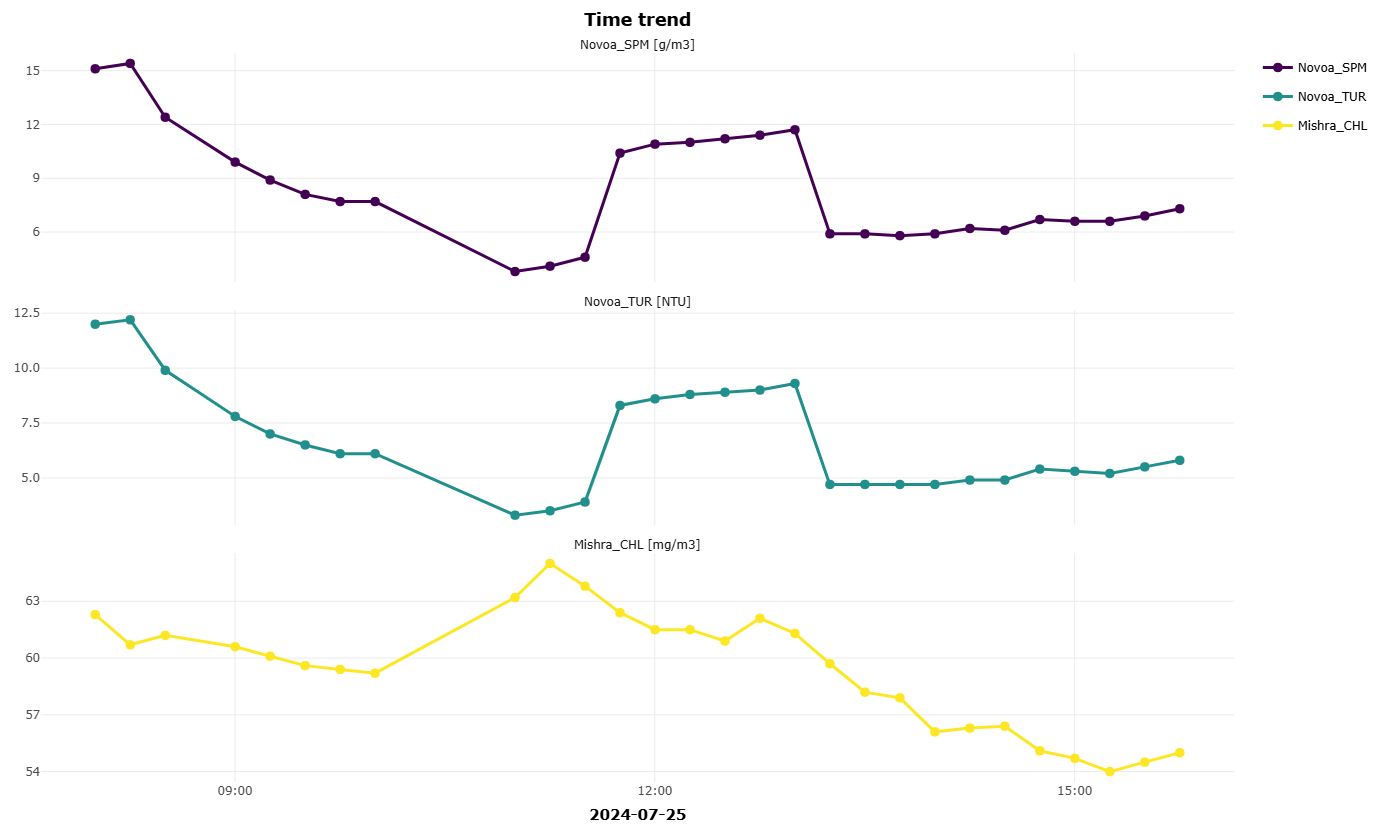
Figure 3. Plot resulting from the
wisp_trend_plot() function showing the temporal trend of
three exemplary parameters (from top to bottom: “Novoa_SPM”,
“Novoa_TUR”, and “Mishra_CHL”) for 25/07/2024 from 8 a.m. to 4 p.m.
(site: Trasimeno).
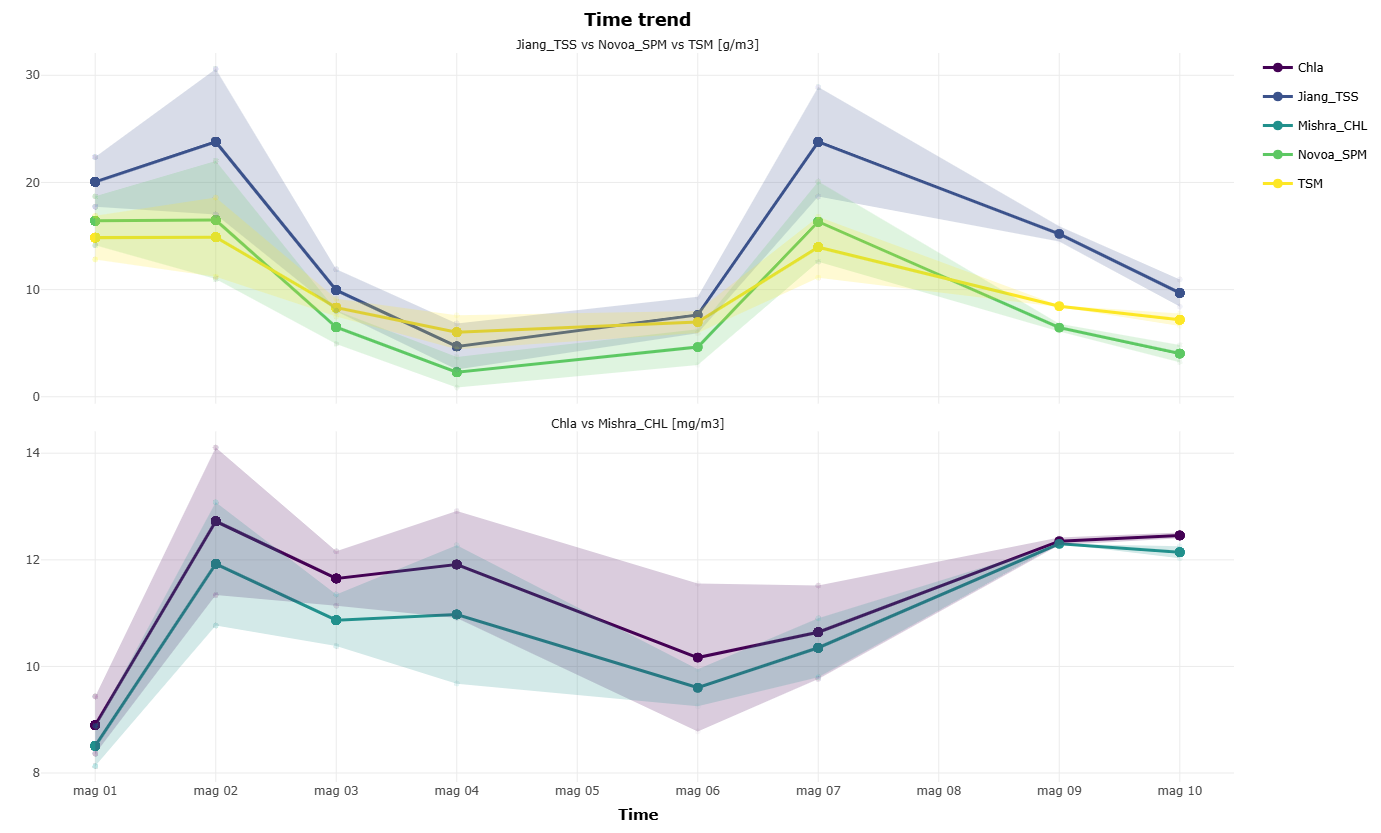
Figure 4. Plot resulting from the
wisp_trend_plot() function showing the temporal trend of
five exemplary parameters averaged on a daily basis: in the upper plot,
a comparison between the WISPstation native algorithm (TSM) and two
third-party algorithms for estimating suspended solids concentration
(“Novoa_SPM” and “Jiang_TSS”); in the lower plot, the comparison between
the WISPstation native chlorophyll-a algorithm (Chla) and Mishra_CHL
algorithm. (site: Trasimeno; period: 01/05/2024 – 10/05/2024).