This is a compartmental model simulation code for generic respiratory virus diseases.
MetaRVM is an open-source R package for modeling the
spread of infectious diseases in subpopulations, which can be flexibly
defined by geography, demographics, or other stratifications. It is
designed to support real-time public health decision-making.
MetaRVM is a metapopulation model, which extends the
classic Susceptible-Infected-Recovered (SIR) framework by propagating
infection across interacting subpopulations (e.g., age groups,
neighborhoods), whose interactions are governed by realistic mixing
patterns.
The MetaRVM model builds upon the SEIR framework by
introducing additional compartments to capture more detailed dynamics of
disease progression, while allowing for heterogeneous mixing among
different demographic stratum. These generalizations allow the model to
account for factors such as vaccinations, hospitalizations, and
fatalities.
For more details, please refer to the paper: Developing and deploying a use-inspired metapopulation modeling framework for detailed tracking of stratified health outcomes
Full documentation is available at: https://RESUME-Epi.github.io/MetaRVM/
The current CRAN release is 2.0.0. Install it with:
install.packages("MetaRVM")To install the development branch for MetaRVM 2.1.0
(branch: feature/simulation-mode-config) directly from
GitHub:
# install.packages("remotes")
remotes::install_github("RESUME-Epi/MetaRVM@feature/simulation-mode-config")library(MetaRVM)
options(odin.verbose = FALSE)
## prepare the configuration file
cfg <- system.file("extdata", "example_config.yaml", package = "MetaRVM")The content of the yaml configuration file:
run_id: ExampleRun
population_data:
  initialization: population_init_n24.csv
  vaccination: vaccination_n24.csv
mixing_matrix:
  weekday_day: m_weekday_day.csv
  weekday_night: m_weekday_night.csv
  weekend_day: m_weekend_day.csv
  weekend_night: m_weekend_night.csv
disease_params:
  ts: 0.5
  ve: 0.4
  dv: 180
  dp: 1
  de: 3
  da: 5
  ds: 6
  dh: 8
  dr: 180
  pea: 0.3
  psr: 0.95
  phr: 0.97
simulation_config:
  start_date: 10/01/2023 # m/d/Y
  length: 150
  nsim: 1
  nrep: 1
  simulation_mode: deterministic
  random_seed: 42
# run simulation
sim_out <- metaRVM(cfg)
#> Loading required namespace: pkgbuild
# basic plot: daily hospitalizations by date
library(ggplot2)
hosp <- sim_out$results[disease_state == "H"]
hosp_sum <- hosp[disease_state == "H", .(total = sum(value)), by = "date"]
ggplot(hosp_sum, aes(date, total)) +
geom_line(, color = "red") +
labs(y = "Hospitalizations", x = "Date") + theme_bw()
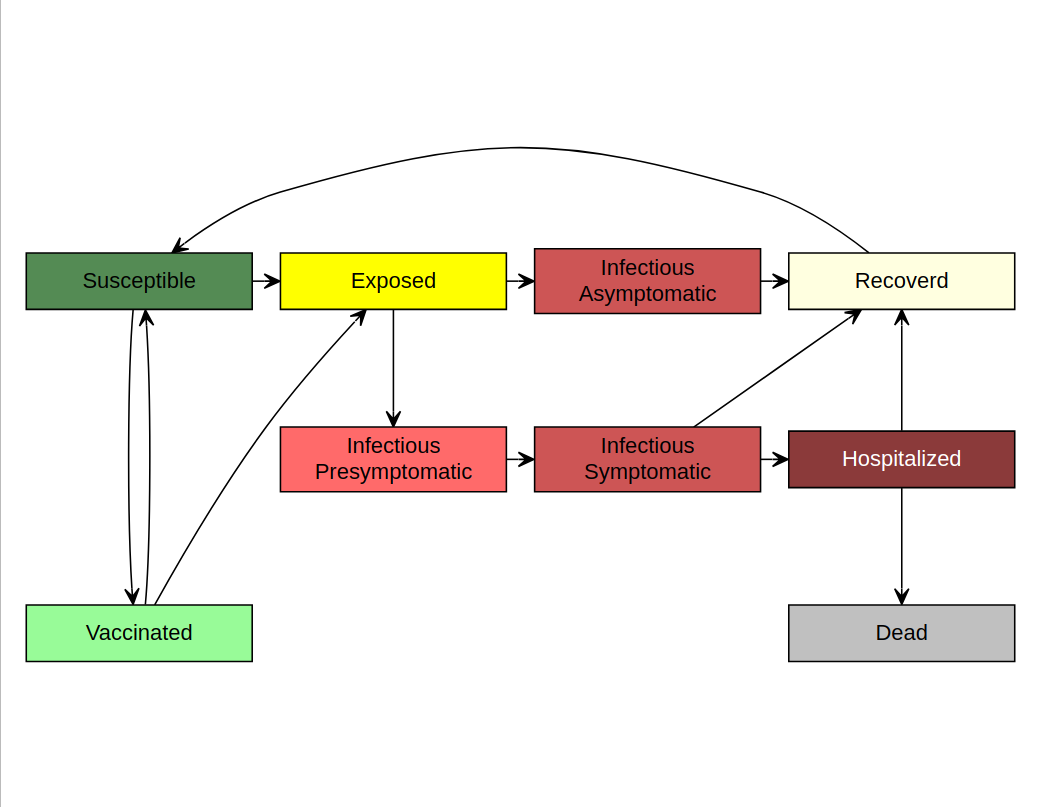
MetaRVM implements a stratified SEIR-type metapopulation
model with vaccination, hospitalization, immunity waning, and
reinfection. The core health states in each demographic stratum are:
SVEI_asympI_presympI_sympHRDAt the start of a simulation, nearly all individuals are in
S, with optional seeding of initial infections and/or
vaccinated individuals in V. When susceptible or vaccinated
individuals come into contact with infectious individuals, they become
exposed (E) based on age/stratum-specific forces of
infection and vaccine protection. Exposed individuals then progress
through asymptomatic, presymptomatic, and symptomatic infectious states
before either recovering, being hospitalized, or dying. Vaccinated and
recovered immunity can wane over time, returning individuals to the
susceptible pool, which allows MetaRVM to represent
multiple respiratory pathogens with different natural histories.
Transmission is stratified by user-defined demographic groups (e.g.,
age, zone, race). Time-varying mixing matrices define how these strata
interact (daytime vs. nighttime, weekday vs. weekend), and
MetaRVM computes stratum-specific forces of infection for
susceptible and vaccinated individuals. Hospitalized and deceased
individuals are excluded from the “effective” mixing population. The
same model can be run in deterministic or stochastic mode, and
parameters are supplied through a YAML configuration.
For simulation control: - nsim is the number of
parameter sets (rows in sampled parameter matrices when distributions
are used) - nrep is the number of simulation replicates per
parameter set - total runs = nsim * nrep -
simulation_mode chooses "deterministic" or
"stochastic" - random_seed ensures
reproducibility for both parameter sampling and stochastic
trajectories
| Parameter | Description | Units / notes |
|---|---|---|
ve |
Vaccine efficacy parameter controlling how strongly vaccination reduces infection risk. | Dimensionless (0–1). |
dv |
Average duration of vaccine-conferred immunity; vaccination wanes at
rate 1/dv. |
Days. |
de |
Average incubation period; duration in E before
becoming infectious. |
Days. |
pea |
Proportion of exposed individuals who become asymptomatic infectious
(Ia). |
Probability (0–1). |
da |
Average duration in asymptomatic infectious state
Ia. |
Days. |
dp |
Average duration in presymptomatic infectious state
Ip. |
Days. |
ds |
Average duration in symptomatic infectious state Is
before recovery or hospitalization. |
Days. |
psr |
Fraction of symptomatic (Is) individuals who recover
directly without hospitalization. |
Probability (0–1). |
dh |
Average length of stay in the hospitalized state
H. |
Days. |
phd |
Proportion of hospitalized individuals who die (transition
H → D); remaining recover. |
Probability (0–1). |
dr |
Average duration of post-infection immunity in R before
waning; reinfection occurs at rate 1/dr. |
Days. |
| Parameter | Description | Units / notes |
|---|---|---|
ts |
Transmission scaling factor for susceptible individuals; controls
strength of S–I transmission. |
Per-contact scaling factor. |
M |
Mixing matrix of order J × J, where m_ij
is the fraction of contacts that a member of stratum i has
with stratum j. |
Dimensionless; rows sum to 1. |
These parameters drive the transitions from S and
V to E, and determine how quickly individuals
move through infectious, hospitalized, recovered, and deceased
states.
MetaRVM is configured through a YAML file and a small
set of CSV inputs.
| Input | Required? | Description |
|---|---|---|
Population initialization (population_init.csv) |
Yes | Defines demographic strata with user-defined category columns (e.g., age, zone, race, income_level) and initial population states (N, S0, I0, R0, V0). Categories are automatically detected from column names. |
Mixing matrices (mixing_matrix_*.csv) |
Yes | Four contact matrices, consistent with the population strata. These typically represent weekday/weekend and day/night mixing patterns. |
Vaccination schedule (vaccination.csv) |
Yes | Time-varying vaccination counts or rates by stratum, used to move
individuals from S to V. |
| Model parameters | Yes | High-level model specification: simulation dates, dt,
parameter values (e.g., ve, de,
dv, pea, psr, βs,
βv), output controls, and checkpointing options. |
| Checkpoint files | Optional | Internal model state snapshots used to resume or branch simulations (e.g., for phased calibration). |
MetaRVM produces simulation results in a unified
tidy long-format table that is easy to analyze with
data.table, dplyr, or ggplot2.
Every record corresponds to a single compartment count or flow quantity
for a specific demographic stratum, simulation date, and
scenario/instance.
The core output is available in:
sim$results — compartment counts and flows for each
daysim$config — the configuration object used to generate
the runMetaRVM includes several vignettes that demonstrate common workflows using real model configurations and data. These provide detailed, step-by-step examples of how to prepare inputs, configure the model, run simulations, and analyze outputs.
The vignettes can be accessed at:
https://resume-epi.github.io/MetaRVM/articles/
List of vignettes:
Getting Started
A gentle introduction showing how to load a configuration file, run a
simulation, and inspect outputs.
Model Configurations
A detailed walkthrough of the YAML structure, required fields, parameter
blocks, optional modules, and how to define population strata and mixing
patterns.
Running Simulation Full example using a complete set of input files, showing how MetaRVM reads population initialization data, mixing matrices, and vaccination schedules.
For the complete function reference, visit: