| Title: | Functions to Estimate Tree Volume and Phytomass in the Italian Forest Inventory 2005 |
| Version: | 2.5.2 |
| Description: | Tabacchi et al. (2011) published a very detailed study producing a uniform system of functions to estimate tree volume and phytomass components (stem, branches, stool). The estimates of the 2005 Italian forest inventory (https://www.inventarioforestale.org/it/) are based on these functions. The study documents the domain of applicability of each function and the equations to quantify estimates accuracies for individual estimates as well as for aggregated estimates. This package makes the functions available in the R environment. Version 2 exposes two distinct functions for individual and summary estimates. To facilitate access to the functions, tree species identification is now based on EPPO species codes (https://data.eppo.int/). |
| License: | GPL (≥ 3) |
| Encoding: | UTF-8 |
| LazyData: | true |
| RoxygenNote: | 7.3.2 |
| Imports: | magrittr, dplyr (≥ 1.1.0), purrr, tibble, tidyr, RColorBrewer, metR, rlang, ggplot2, Matrix |
| Suggests: | testthat |
| URL: | https://gitlab.com/NuoroForestrySchool/ForIT.git, https://zenodo.org/records/5790157 |
| Depends: | R (≥ 2.10) |
| NeedsCompilation: | no |
| Packaged: | 2025-12-10 10:25:59 UTC; nicolapuletti |
| Author: | Nicola Puletti  [aut, cre],
Mirko Grotti [aut],
Roberto Scotti
[aut]
[aut, cre],
Mirko Grotti [aut],
Roberto Scotti
[aut] |
| Maintainer: | Nicola Puletti <nicola.puletti@gmail.com> |
| Repository: | CRAN |
| Date/Publication: | 2025-12-10 11:00:10 UTC |
ForIT: A package that implements as R functions the INFC-2005 equations estimating single tree volume and phytomass .
Description
The ForIT package provides two main functions, estimating respectively individual and summary values, and some accessory functions, facilitating package use and documenting its content
Author(s)
Maintainer: Nicola Puletti nicola.puletti@gmail.com (ORCID)
Authors:
Mirko Grotti mirko.grotti@gmail.com
Roberto Scotti scotti@uniss.it (ORCID)
References
Tabacchi G., Di Cosmo L., Gasparini P., Morelli S., 2011a. Stima del volume e della fitomassa delle principali specie forestali italiane. Equazioni di previsione, tavole del volume e tavole della fitomassa arborea epigea. Stima del volume e della fitomassa delle principali specie forestali italiane. Equazioni di previsione, tavole del volume e tavole della fitomassa arborea epigea. 412 pp.
Tabacchi G., Di Cosmo L., Gasparini P., 2011b. Aboveground tree volume and phytomass prediction equations for forest species in Italy. European Journal of Forest Research 130: 6 911-934
See Also
Useful links:
Pipe operator
Description
See magrittr::%>% for details.
Usage
lhs %>% rhs
'ForIT'-package Database - Ver.2
Description
The package exposes 5 tightly interconnected tibbles:
INFCspecies, INFCcatalog, Quantities, INFCparam, INFCf_domains
Usage
INFCspecies

INFCcatalog

Quantities

INFCparam

INFCf_domains
Format
An object of class tbl_df (inherits from tbl, data.frame) with 44 rows and 3 columns.
An object of class tbl_df (inherits from tbl, data.frame) with 26 rows and 4 columns.
An object of class tbl_df (inherits from tbl, data.frame) with 5 rows and 2 columns.
An object of class tbl_df (inherits from tbl, data.frame) with 130 rows and 5 columns.
An object of class tbl_df (inherits from tbl, data.frame) with 617 rows and 4 columns.
Details
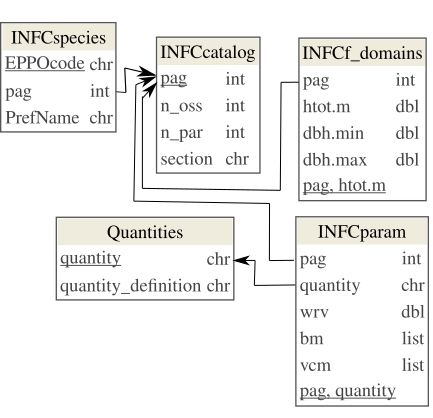
Tables columns
INFCspecies
-
EPPOcode [PK]: species code, adopting EPPO database -
pag: section page number in the original reference (Tabacchi et al., 2011a) -
PrefName: EPPO preferred name for the species
INFCcatalog
-
pag [PK]: section page number in the original reference (Tabacchi et al., 2011a) -
n_oss: number of sample trees for the section -
n_par: number of parameters in the equations for the section -
section: section name (species or species group)
Quantities
-
quantity [PK]: code of the estimated quantity -
quantity_definition: estimated quantity definition and measurement units
INFCparam
-
pag [PK]: section page number in the original reference (Tabacchi et al., 2011a) -
quantity [PK]: code of the estimated quantity (see Quantities) -
wrv: weighted residual variance -
bm: functions coefficients (a list of arrays) -
vcm: variance-covariance matrices (a list of 'dspMatrix')
INFCf_domains
-
pag [PK]: section page number in the original reference (Tabacchi et al., 2011a) -
htot.m [PK]: tree height class [m] (class width 1 m) -
dbh.min: minimum tree diameter class [cm] (class width 1 cm) -
dbh.max: maximum tree diameter class [cm] (class width 1 cm)
Columns bm and vcm are lists, the dimensions of the arrays and
matrices they store vary depending on n_par.
Matrices in vcm are symmetric, stored as "dspMatrix" class objects.
Database schema is defined, verified and illustrated using package dm
library(dm)
ForIT_DB <- dm(INFCcatalog,
               INFCspecies,
               Quantities,
               INFCparam,
               INFCf_domains) %>%
  dm_add_pk(INFCcatalog, pag, check = TRUE) %>%

  dm_add_pk(INFCspecies, EPPOcode, check = TRUE) %>%
  dm_add_fk(INFCspecies, pag, INFCcatalog, check = TRUE) %>%

  dm_add_pk(Quantities, quantity, check = TRUE) %>%

  dm_add_pk(INFCparam, c(pag, quantity), check = TRUE) %>%
  dm_add_fk(INFCparam, pag, INFCcatalog, check = TRUE) %>%
  dm_add_fk(INFCparam, quantity, Quantities, check = TRUE) %>%

  dm_add_pk(INFCf_domains, c(pag, htot.m), check = TRUE) %>%
  dm_add_fk(INFCf_domains, pag, INFCcatalog, check = TRUE)

dm_examine_constraints(ForIT_DB)

dm_draw(ForIT_DB, rankdir = "BT", view_type = "all", column_types = T)
'ForIT'-package TEST-data - Ver.2
Description
A tiny test dataset including example data displayed in Tabacchi et al. (2011), the basic reference for ForIT package.
Usage
ForIT_test_data
Format
A data frame with 16 rows and 5 variables:
Details
The dataset is produced by the following code.
ForIT_test_data <- dplyr::tribble(
  ~UC, ~IdF, ~specie, ~d130, ~h_dendro,
  # UC: Plot Id (Unità Campionaria)
  # IdF: Stem ID (Identificativo Fusto)
  # specie: EPPO species code (see https://gd.eppo.int/)
  #  - ACRCA: Acer campestre
  #  - ABIAL: Abies alba
  #  - FAUSY: Fagus sylvatica
  # d130: trunk diameter at breast height [cm]
  # h_dendro: tree height [m]
 # Example data in Tabacchi et al. (2011) pag. 25
  "U1","01","ACRCA",10,7,
  "U1","02","ACRCA",15,9,
  "U1","03","ACRCA",20,12,
  "U1","04","ACRCA",30,20,
  "U1","05","ACRCA",32,21,
  "U1","06","ACRCA",24,18,
  "U1","07","ACRCA",36,21,
  "U1","08","ACRCA",40,22,
  "U1","09","ACRCA",8,8,
  "U1","10","ACRCA",18,12,

 # Example continuation, pag. 27
  "U2","01","ABIAL",38,21,
  "U2","02","ABIAL",52,28,
  "U2","03","FAUSY",25,16,
  "U2","04","FAUSY",30,18,
  "U2","05","FAUSY",12,10,

 # Extra lines, to test for 'out of domain'
  "U0","01","ACRCA",22,14,   # pag. 24
  "U0","02","ACRCA",30,10
 )
'ForIT'-package Auxiliary pre-computed data - Ver.2
Description
A large dataset used by 'INFCaccuracyPlot0()' to speed the production of a fine resolution CV surface for the plots.
Usage
INFC_CVgrid
Format
A data frame with 167560 rows and 7 variables:
- pag
see 'INFCcatalog' primary key
- quantity
see 'Quantities'
- dbh
trunk diameter at breast height (dbh), in cm
- h_tot
tree height, in m
- cv_ie
coefficient of variation for an individual estimate
- cv_ea
coefficient of variation for the estimate of an average
- est
estimated value for the selected 'quantity'. See 'INFCvpe()' for more details
- n_par
number of parameters that the function requires
- inD
is the (dbh, htot) point within the function domain?
Details
The dataset is produced by the following code.
 Populate_INFC_CVgrid <- function() {
 INFCcatalog %>%
   select(pag) %>%
   inner_join(INFCspecies %>%
                select(pag, EPPOcode),
              by = "pag") %>%
   group_by(pag) %>%
   summarise(EPPOcode = first(EPPOcode),
             .groups = "drop") %>%
   inner_join(Quantities %>% select(quantity), by = character()) %>%
   mutate(grid.k = pmap(list(pag, EPPOcode, quantity), compute_grid0)) %>%
   select(-EPPOcode) %>%
   unnest(cols = c(grid.k)) %>%
   return()
 }
The range of applicability of INFCvpe() function
Description
A data.frame containing the "range of applicability" (or "domain")
of INFCvpe() function
Format
A data frame with 18563 observations on the following 2 variables.
keya character vector
in.rangea factor with levels
y
References
Tabacchi G., Di Cosmo L., Gasparini P., Morelli S., 2011a. Stima del volume e della fitomassa delle principali specie forestali italiane. Equazioni di previsione, tavole del volume e tavole della fitomassa arborea epigea. Stima del volume e della fitomassa delle principali specie forestali italiane. Equazioni di previsione, tavole del volume e tavole della fitomassa arborea epigea. 412 pp. [ITA, ita]
Reproduce the tables that Tabacchi et al. published in 2011
Description
The tables published in the work on which this package is based, convey a very
relevant part of the information produced: printed numbers serve as reference to
verify that coded functions return expected results and, more specifically, empty
spaces in the printed tables signal function applicability domain. In other words,
measurement data used to estimate function coefficients values, cover only the
portion of the (dbh, htot) plane where numbers are printed.
Usage
INFCtabulate(
  EPPOcode,
  quantity = "vol",
  dbh.by = 5,
  htot.by = 3,
  digits = 1,
  print_tab = T
)
Arguments
EPPOcode |
tree species code defined by the EPPO database https://gd.eppo.int/search. Lookup 'INFCspecies' dataframe to retrieve recognized codes. |
quantity |
for each species (or species group) different quantities can be estimated. Quantity's definitions and Ids are exposed by the 'Quantities' dataframe. Default value is "vol", estimation of timber volume. |
dbh.by |
... |
htot.by |
increment value between rows
(respectively columns) expressed in 'cm' (respectively 'm') for |
digits |
number of decimal digits to expose in the table. Default one decimal digit. |
print_tab |
defaults to TRUE in order to produce a text output. If set to FALSE no printing will occur (see 'return') |
Value
Function principal output is the printout of the volume or phytomass tables. If print_tab = FALSE, the function will only return a tibble with a list column containing the tabulation of the required estimation equation/s. Using default values, tables will be identical (or anyway similar) to the corresponding published tables, with white (NA) cells delimiting the domain of applicability of the equation.
Examples
## Not run:
  INFCtabulate(c("ABIAL", "ACRCA"),
                quantity = "vol",
                dbh.by = 5,
                htot.by = 3,
                digits = 1)
  # EPPO code:  ABIAL  - pag =  33  - quantity =  vol
  #     htot.m
  # dbh.cm    7    10    13    16     19     22     25     28     31
  # 9  23.2  32.4    NA    NA     NA     NA     NA     NA     NA
  # 14   NA  77.9 100.2    NA     NA     NA     NA     NA     NA
  # 19   NA 142.3 183.3 224.3     NA     NA     NA     NA     NA
  # 24   NA    NA 291.1 356.4  421.8  487.2     NA     NA     NA
  # 29   NA    NA    NA 518.9  614.3  709.8  805.2     NA     NA
  # 34   NA    NA    NA 711.6  842.8  974.0 1105.2 1236.4     NA
  # 39   NA    NA    NA    NA 1107.2 1279.8 1452.5 1625.1 1797.7
  # 44   NA    NA    NA    NA     NA 1627.2 1847.0 2066.7 2286.5
  # 49   NA    NA    NA    NA     NA 2016.3 2288.8 2561.4 2833.9
  # 54   NA    NA    NA    NA     NA     NA 2778.0 3109.0 3439.9
  # 59   NA    NA    NA    NA     NA     NA 3314.4 3709.5 4104.6
  # 64   NA    NA    NA    NA     NA     NA     NA 4363.1 4828.0


  # ---
  #   EPPO code:  ACRCA  - pag =  231  - quantity =  vol
  # htot.m
  # dbh.cm  7.5  10.5  13.5  16.5   19.5   22.5
  # 9.5  26.8  36.8    NA    NA     NA     NA
  # 14.5   NA  83.6 106.9    NA     NA     NA
  # 19.5   NA 149.7 192.0 234.3  276.6     NA
  # 24.5   NA    NA 302.2 369.0  435.7     NA
  # 29.5   NA    NA    NA 534.2  631.0  727.8
  # 34.5   NA    NA    NA 729.9  862.4  994.8
  # 39.5   NA    NA    NA    NA 1129.9 1303.5
  # ---

## End(Not run)
Estimate bole volume or tree phytomass for individual stems, with associated accuracy info
Description
Using the functions developed for INFC 2005 (the 2005 Italian national forest inventory),
stem volume or tree compartment phytomass are estimated for each
(EPPOcode, dbh.cm, htot.m) input tuple.
Accompaining the main value, accuracy estimates are returned, as attributes.
The functions are documented in Tabacchi et al. (2011a)
Usage
INFCvpe(EPPOcode, dbh.cm, htot.m, quantity = "vol")
Arguments
EPPOcode |
Character vector of tree species code, as defined in EPPO database,
(See |
dbh.cm |
Numeric vector of stem/s breast height diameter (in cm) |
htot.m |
Numeric vector of tree total height/s (in m). Length equal to dbh.cm vector or one. In this case same value will be replicated for all dbh.cm entries |
quantity |
(default = |
Details
Output value will have following added attributes with estimates accuracy evaluations for each stem:
-
pag- page number, referred to original source -
wrv- weighted residual variance -
Var_ea- variance for an estimated average
or variance for 'confidence interval' estimation, seeprediction.lm(.., interval = "confidence") -
Var_ie- variance for an individual estimate
or 'prediction variance', (seeprediction.lm(.., interval = "prediction")and Freese, 1964 - in:Tabacchi, 2011 -
InDomain- logical indicating whether the (dbh, htot) point lies out of the domain explored by the experimental data (see 'INFCtabulate()')
Value
The functions returns a Numeric vector of the same length
of the dbh.cm argument, with accuracy info as attributes
See Also
INFCvpe_summarise() and functions related to INFCvpe_sum() to produce
estimates of aggregates with better accuracy evaluation
Examples
# COMPARE WITH Tabacchi (2011a) page 25 ----
(v <- INFCvpe("ACRCA", dbh.cm = 22, htot.m = 14))
# [1] 252.9581
# attr(,"pag")
# [1] 231
# attr(,"wrv")
# [1] 2.271e-05
# attr(,"Var_ea")
# [1] 33.17182
# attr(,"Var_ie")
# [1] 1075.883
# attr(,"InDomain")
# [1] TRUE

# Standard Error of the Estimate
see <- sqrt(attr(v, "Var_ie"))
# Degrees of freedom
df <- INFCcatalog$n_oss[INFCcatalog$pag == attr(v, "pag")] -
      INFCcatalog$n_par[INFCcatalog$pag == attr(v, "pag")]
# confidence level
p <- 95/100
# Confidence Interval Half Width
cihw <- qt(1-(1-p)/2, df) * see
cat(" *** Volume confidence interval (p = ", p*100, "%) is [", round(v, 1),
    " +/- ", round(cihw, 1), "] dm^3\n", sep = "")

# ESTIMATION OF PHYTOMASS ----
Quantities[5,] %>% as.data.frame()
#   quantity         quantity_definition
# 1      dw4 phytomass of the whole tree [kg]
tree_phy <- INFCvpe(c("ACRCA", "ALUCO"),
                    dbh.cm = c(22, 15),
                    htot.m = c(14, 16),
                    quantity = "dw4")
tree_phy
# [1] 185.1291  87.7970
# attr(,"pag")
# [1] 231 245
# attr(,"wrv")
# [1] 3.142e-05 2.104e-05
# attr(,"Var_ea")
# [1] 45.89002  9.12407
# attr(,"Var_ie")
# [1] 1488.5135  281.8072
# attr(,"InDomain")
# [1] TRUE TRUE

# PROCESSING A TALLY DATA-FRAME ----
tst_vol <- ForIT_test_data %>%
  dplyr::mutate(vol = INFCvpe(specie, d130, h_dendro),
                OutOfDomain = !attr(vol, "InDomain"))
tst_vol %>%
  dplyr::filter(OutOfDomain)
tst_vol %>%
  dplyr::filter(UC == "U1")

# SUMS AND direct ACCUARACY AGGREGATION (instead of via ?INFCvpeSUM) ----
df <- function(pag) return(
  INFCcatalog %>%
    dplyr::right_join(tibble::tibble(pag = !!pag), by = "pag") %>%
    dplyr::transmute(df = n_oss - n_par) %>%
    purrr::pluck(1)
)
p <- 95/100
tst_vol %>%
  dplyr::mutate(cihw = qt(1-(1-p)/2,
                          df(attr(vol, "pag"))) *
                  sqrt(attr(vol, "Var_ie"))
  ) %>%
  dplyr::filter(!OutOfDomain) %>%
  dplyr::group_by(specie) %>%
  dplyr::summarise(.groups = "drop",
                   est = sum(vol),
                   cihw = sqrt(sum(cihw^2)),
  ) %>%
  dplyr::left_join(INFCspecies %>% dplyr::select(EPPOcode, pag),
                   by = c("specie" = "EPPOcode")) %>%
  dplyr::left_join(INFCcatalog %>% dplyr::select(pag, section),
                   by = "pag") %>%
  dplyr::select(-c(specie, pag)) %>%
  dplyr::rename(specie = section) %>%
  dplyr::mutate(dplyr::across(c("est", "cihw"), ~round(.x, 1))) %>%
  dplyr::arrange(specie) %>%
  dplyr::select(specie, est, cihw) -> tab
tab[c(2,1,3),] %>%
  t()
rm(tst_vol, tab, df)
Estimate tree bole volume or phytomass for stems groups, with associated accuracy info
Description
Cumulative estimation of the volume or phytomass of groups of trees is just
the summation of the values computed with INFCvpe(), but the computation of
accuracy estimates is improved using these summation functions.
Two approaches are available.
Via
INFCvpe_summarise()that processes and returns a data frameor by following aggregation functions within a standard
summarise():-
INFCvpe_sum() -
INFCvpe_ConfInt() -
INFCvpe_OutOfDomain()
-
Usage
INFCvpe_summarise(
  in.data,
  EPPOcode_C,
  dbh_C,
  h_tot_C,
  quantity = "vol",
  p = 0.95
)

INFCvpe_sum(EPPOcode, dbh, h_tot, quantity = "vol")

INFCvpe_ConfInt(EPPOcode, dbh, h_tot, quantity = "vol", p = 0.95)

INFCvpe_OutOfDomain(EPPOcode, dbh, h_tot)
Arguments
in.data |
A dataframe (or tibble) containing tally data to be matched with "EPPOcode_C", "dbh_C" and "htot_C" arguments |
EPPOcode_C |
A string, the name of the column in |
dbh_C |
A string, the name of the column in |
h_tot_C |
A string, the name of the column in |
quantity |
(default =
|
p |
(default OPZIONE 2 |
EPPOcode |
A character vector with the species EPPO codes (with length = 1 or length = length(dbh)) |
dbh |
A numeric vector with the brest height diameter values |
h_tot |
A numeric vector with the tree total height values (with length = 1 or length = length(dbh)) |
Details
Functions developed following Tabacchi et al. (2011), pages 23-26.
Value
-
INFCvpe_summarise()returns a dataframe (tibble) with the grouping columns defined withgroup_by(), and the following columns:-
quantity: as additional grouping column, -
n: number of trees in the group, -
n_out: the number of(dbh, htot)pairs that are 'out of the domain', -
est: the estimated value, -
cihw: confidence interval half width -
p: probability used computingcihw
-
-
INFCvpe_SUM- the functions of this family return a numeric vector, aggregating rows within the same group,-
INFCvpe_sum()returns the sum of the estimated quantities, -
INFCvpe_ConfInt()returns 'confidence interval half width', -
INFCvpe_OutOfDomain()returns the number of 'out of domain'(dhb, h_tot)pairs included in the summation
-
See Also
INFCvpe() to compute individual estimates, with detailed accuracy evaluation
Examples
## Not run:
Sezione <- function(EPPOcodes){
  # retrieve 'Sezione' name, decoding EPPO codes
  INFCspecies %>%
    dplyr::filter(EPPOcode %in% EPPOcodes) %>%
    dplyr::left_join(INFCcatalog,by = "pag")%>%
    dplyr::select(section) %>%
    purrr::pluck(1)
}

tst <- ForIT_test_data %>%
  dplyr::filter(UC != "U0")
# select Tabachi et al. example data

tst %>%
  dplyr::group_by(specie) %>%
  INFCvpe_summarise("specie", "d130", "h_dendro") %>%
  dplyr::ungroup() %>%
  dplyr::mutate(specie = Sezione(specie),
                dplyr::across(c("est", "cihw"), ~round(.x, 1))
  ) %>%
  dplyr::select(specie, est, cihw) %>%
  dplyr::arrange(specie) %>%
  dplyr::slice(2, 1, 3) %>%
  t() %>%
  provideDimnames(base = list(dimnames(.)[[1]], ""), unique=FALSE)
# Compare ForIT (ver 2) output
## specie "Aceri"  "Abete bianco" "Faggio"
## est    "4623.0" "4044.2"       "1079.4"
## cihw   "567.5"  "661.2"        "275.4"
# with 'Tabella 2' in Tabacchi et al. (2011, pag. 27)
## specie "aceri"  "abete bianco" "faggio"
## est    "4623.0" "4044.2"       "1079.4"
## cihw   "567.4"  "662.4"        "279.2"

# Using 'INFCvpe_summarise()'

## Overall totals
tst %>%
  INFCvpe_summarise("specie", "d130", "h_dendro", quantity = c("vol", "dw4"))

## Group by dbh class ('cld')
tst %>%
  dplyr::mutate(cld = ceiling(d130/5)*5) %>%
  dplyr::group_by(UC, specie, cld) %>%
  INFCvpe_summarise("specie", "d130", "h_dendro")

## Group by sampling unit ('UC')
tst %>%
  dplyr::group_by(UC) %>%
  INFCvpe_summarise("specie", "d130", "h_dendro", quantity = "dw4")

# Using 'INFCvpeSUM' aggregation functions

## Esitmate 'dw4' phytomass, by sampling unit ('UC')
tst %>%
  dplyr::group_by(UC) %>%
  dplyr::summarise(
    n_stems = dplyr::n(),
    OoD = INFCvpe_OutOfDomain(specie, d130, h_dendro),
    dw4 = INFCvpe_sum(specie, d130, h_dendro, quantity = "dw4"),
    dw4_ConfInt = INFCvpe_ConfInt(specie, d130, h_dendro, quantity = "dw4")
  )

## Esitmate volume, by sampling unit ('UC')
tst %>%
  dplyr::group_by(UC) %>%
  dplyr::summarise(
    n_stems = dplyr::n(),
    OoD = INFCvpe_OutOfDomain(specie, d130, h_dendro),
    vol = INFCvpe_sum(specie, d130, h_dendro),
    vol_ConfInt = INFCvpe_ConfInt(specie, d130, h_dendro)
  )

rm(tst, Sezione)

## End(Not run)
Plotting the accuracy and reliability region (or 'domain') of the volume and phytomass estimation functions
Description
Volume and phytomass functions are tabulated in Tabacchi et al. (2011a).
The tabulation covers a limited region of the dbh by h_tot rectangle.
This region is the "domain" of the reliable estimates, based on the
distribution of the sample trees used to calibrate the functions.
The coefficient of variation (CV = standard_deviation / estimate) is computed
and plotted (as 'filled contours') for the whole rectangular area,
the limits of the region of reliable estimates (the "domain"), is
superimposed as a light colored line. Function output is a ggplot object that can be used
by its self or as a background on top of which the user can plot his/her data to
verify eventual accuracy or reliability problems.
Two functions are available.
-
INFCaccuracyPlot()- allows the plots to be fully customized but, beware, all values required for the 'fill' will be computed and, at finer resolution, the process can be slow. -
INFCaccuracyPlot0()- produces, much faster, the plots at the finest resolution, using pre-calculated values stored in a specific auxiliary data.frame (seeINFC_CVgrid), necessarily leaving less customization freedom.
(** compute_grid0() - is an internal function exported for the sake of
the Populate_INFC_CVgrid() function **)
Usage
INFCaccuracyPlot(
  EPPOcod,
  quantity = "vol",
  ie.Var = FALSE,
  cv.ul = 0.1,
  fixed = TRUE,
  plot.est = FALSE,
  dbh.step = 5,
  htot.step = dbh.step,
  dbh.buf = 1,
  htot.buf = dbh.buf
)

INFCaccuracyPlot0(
  EPPOcod,
  quantity = "vol",
  ie.Var = FALSE,
  cv.ul = 0.1,
  fixed = TRUE,
  plot.est = FALSE
)

compute_grid0(pag, EPPOcod, quantity)
Arguments
EPPOcod |
A string, one of the EPPO tree species codes listed in
|
quantity |
(optional) A string specifying the quantity to be estimated,
one of |
ie.Var |
(optional) Logical. Choose variance estimator:
|
cv.ul |
(optional) Numeric. Cutoff CV level for the plot. Defaults to 0.1 |
fixed |
(optional) Logical. Contour plot breaks:
|
plot.est |
(optional) Logical. Add the 'estimated quantity' layer as
contour lines. Default |
dbh.step |
(optional) Numeric. Computation with smaller step produces a
plot with better resolution but increases consistently computation time
(see |
htot.step |
(optional) Numeric. As for dbh. |
dbh.buf |
(optional) Numeric. Extra space in the plot beyond the 'domain'. Default: 1 |
htot.buf |
(optional) Numeric. As for dbh. |
pag |
for the internal function |
Value
INFCaccuracyPlot The function returns a ggplot object.
Examples
## Not run:
INFCaccuracyPlot("FRXAN") # 'INFCaccuracyPlot()' can be slow because
#       it computes all the CV values needed to fill backgroud plot,
#              hence default values are set to a coarser resolution.
\donttest{
  INFCaccuracyPlot("FRXAN",
                   dbh.step = 1,
                   htot.step = 1)
  # computing with high resolution is slow
}

INFCaccuracyPlot0("FRXAN")
# 'INFCaccuracyPlot0()' is quick, it uses stored values
INFCaccuracyPlot0("FRXAN", "dw4")
INFCaccuracyPlot0("FRXAN", "dw4", ie.Var = TRUE)
# deafult fixed break values are not alwais optimal
INFCaccuracyPlot0("FRXAN", "dw4", ie.Var = TRUE, fixed = FALSE, cv.ul=.9)
# tailoring can improve
INFCaccuracyPlot0("FRXAN", plot.est = TRUE)
# 'quantity' estimation iso-lines can be superimposed


background <- INFCaccuracyPlot0("ACROP", plot.est = TRUE)
foreground <-  ForIT_test_data %>%
  dplyr::filter(specie == "ACROP") %>%
  dplyr::mutate(vol = INFCvpe(specie, d130, h_dendro)) %>%
  ggplot2::geom_point(map = ggplot2::aes(h_dendro, d130, size = vol))
background + foreground  # Adding a custom foreground
rm(background, foreground)

INFCaccuracyPlot0("ABIAL")
# high resolution and quick, using pre-calculated backgroung values
INFCaccuracyPlot("ABIAL")
# default values produce a coarser resolution

## End(Not run)