| Title: | Confidentiality of Spatial Point Data |
| Version: | 1.0.6 |
| Date: | 2026-02-04 |
| Depends: | R (≥ 3.3.2), methods, stats, sp (≥ 2.0-0), dplyr, rlang, |
| Description: | Provides an automatic aggregation tool to manage point data privacy, intended to be helpful for the production of official spatial data and for researchers. The package pursues the data accuracy at the smallest possible areas preventing individual information disclosure. The methodology, based on hierarchical geographic data structures performs aggregation and local suppression of point data to ensure privacy as described in Lagonigro, R., Oller, R., Martori J.C. (2017) <doi:10.2436/20.8080.02.55>. The data structures are created following the guidelines for grid datasets from the European Forum for Geography and Statistics. |
| License: | MIT + file LICENSE |
| Suggests: | sf, knitr, devtools, rmarkdown |
| Encoding: | UTF-8 |
| LazyData: | true |
| RoxygenNote: | 7.2.3 |
| VignetteBuilder: | knitr |
| NeedsCompilation: | no |
| Packaged: | 2026-02-04 15:14:35 UTC; raymond |
| Author: | Raymond Lagonigro  [aut, cre],
Ramon Oller [aut],
Joan Carles Martori
[aut]
[aut, cre],
Ramon Oller [aut],
Joan Carles Martori
[aut] |
| Maintainer: | Raymond Lagonigro <raymond.lagonigro@uvic.cat> |
| Repository: | CRAN |
| Date/Publication: | 2026-02-04 15:40:07 UTC |
AQuadtree: A package to anonymise spatial points data.
Description
This package provides an S4 class for creating, manipulating and exporting spatial quadtree varying size grids, and for methods including print/show, plot, spplot, subset, [, [[, names, dim, summary, write.
Introduction
The quadtree functions and class provide the tools to build a varying size quadtree grid performing a bottom-up aggregation considering a minimum threshold for each the cell. The main goal of the package is the anonymization of a set of spatial point data by an aggregation process as in a k-anonymity model. The grid created follows the INSPIRE Specification on Geographical Grid Systems.
Author(s)
Maintainer: Raymond Lagonigro raymond.lagonigro@uvic.cat (ORCID)
Authors:
Ramon Oller ramon.oller@uvic.cat (ORCID)
Joan Carles Martori martori@uvic.cat (ORCID)
References
INSPIRE Data Specification on Geographical Grid Systems – Technical Guidelines https://knowledge-base.inspire.ec.europa.eu/publications/inspire-data-specification-geographical-grid-systems-technical-guidelines_en
EEA reference grid dataset https://data.europa.eu/euodp/data/dataset/data_eea-reference-grids-2
Class "AQuadtree".
Description
An S4 class representing a Quadtree hierarchical geographic Grid to anonymise spatial point data.
Objects can be created by calls to the function AQuadtree
Wrapper function AQuadtree.
Usage
AQuadtree(
  points,
  dim = 1000,
  layers = 5,
  colnames = NULL,
  threshold = 100,
  thresholdField = NULL,
  funs = NULL,
  ineq.threshold = 0.25,
  loss.threshold = 0.4
)
Arguments
points |
object of class "SpatialPoints" or "SpatialPointsDataFrame". |
dim |
a single integer specifying the initial cell sizes in meters, defaults to 1000. |
layers |
a single integer specifying the number of divisions of the initial cells, defaults to 5. |
colnames |
character string or character string vector specifying the columns to summarise in the resulting quadtree. |
threshold |
number. The threshold minimum value each cell must have
in the column |
thresholdField |
character string specifying the column at which the
|
funs |
character string or character string vector specifying the summary
functions for each of the |
ineq.threshold |
inequality threshold value to be considered on the disaggregation process. Forces disaggregation under the given inequality threshold. |
loss.threshold |
loss threshold value to be considered on the disaggregation process. Forces aggregation when there's much loss (i.e loss rate > ineq.threshold ). |
Details
Given a set of points, the AQuadtree class represents a
varying size Quadtree grid created performing a
bottom-up aggregation considering a minimum threshold for each cell.
Cells with a value under the threshold for the thresholdField are
aggregated to the upper level in a quadtree manner.
When no thresholdField is given, total number of points in the cell
will be used, and so, given a threshold of k, none of the cells in the
resulting grid have a value less than k individuals as in a k-anonymity model.
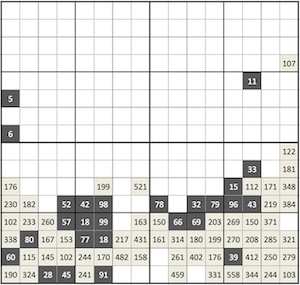
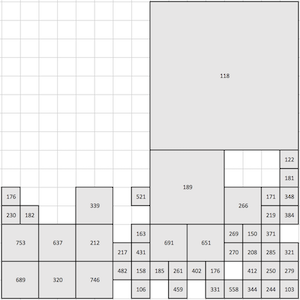
The Quadtree produced balances information loss and accuracy. For instance,
for the set of cells in the left image, where numbers in the cells represent
the values in the thresholdField, using a threshold value of 100,
the resulting Quadtree will be the one on the right. As we can see, some cells
will be discarded, and some aggregated to maintain as much information as
possible, keeping at the same time as much disaggregation as possible
The INSPIRE coding system for cell identifiers will be used to generate a
CellCode and CellNum for each cell in the Quadtree.
The objective of the coding system is to generate unique
identifiers for each cell, for any of the resolutions.
The cellCode is a text string, composed of cell size and cell coordinates.
Cell codes start with a cell size prefix. The cell size is denoted in meter (m)
for cell sizes below 1000 m and kilometre (km) for cell sizes from 1000 m and
above.
Example: a 100 meter cell has an identifier starting with “100m”, the
identifier of a 10000 meter cell starts with “10km”.
The coordinate part of the cell code reflects the distance of the lower left
grid cell corner from the false origin of the CRS. In order to reduce the
length of the string, Easting (E) and Northing (N) values are divided by
10^n (n is the number of zeros in the cell size value). Example for a cell
size of 10000 meters: The number of zeros in the cell size value is 4.
The resulting divider for Easting and Northing values is 10^4 = 10000.
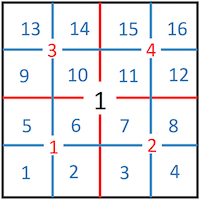
The CellNum is a sequence of concatenated integers identifying all the
hierarchical partitions of the main cell in which the point resides.
For instance, the CellNum of the top right cell would be 416 (fourth
in first partition, sixteenth in second partition)
The input object must be projected and units should be in 'meters'
because the system uses the INSPIRE coding system.
function to create an object of class AQuadtree
Value
AQuadtree object representing a varying size Quadtree aggregation for the given points.
Slots
dim= "numeric"
layers= "numeric",
colnames= "character",
threshold= "numeric",
thresholdField= "character",
loss= "numeric"
See Also
-
INSPIRE Data Specification on Geographical Grid Systems – Technical Guidelines https://knowledge-base.inspire.ec.europa.eu/publications/inspire-data-specification-geographical-grid-systems-technical-guidelines_en
-
EEA reference grid dataset https://data.europa.eu/euodp/data/dataset/data_eea-reference-grids-2
Examples
data("BarcelonaPop", "BarcelonaCensusTracts")
aquadtree.Barcelona<-AQuadtree(BarcelonaPop, layers = 3)
plot(aquadtree.Barcelona)

aQuadtree.Charleston<-AQuadtree(CharlestonPop, colnames="sex", threshold=17,
  thresholdField=c("sex.male", "sex.female"))

## Not run:
## spatial object not projected
sp.not.projected<-spTransform(CharlestonPop,CRS("+proj=longlat +datum=NAD27"))
is.projected(sp.not.projected)
aqt<-AQuadtree(sp.not.projected)

## not an SpatialPoints object
aqt<-AQuadtree(CharlestonCensusTracts)

## too many subdivisions
aqt<-AQuadtree(CharlestonPop, layers=15)


## End(Not run)
Census tract borders of Barcelona city in Catalonia.
Description
A SpatiaPolygons object containing the Census tract borders of Barcelona city in Catalonia.
Usage
BarcelonaCensusTracts
Format
A SpatialPolygons object
Radomly created population points for Barcelona city in Catalonia.
Description
A dataset containing randomly created population for the Barcelona city in Catalonia for the year 2018. Population has been created randomly with the real distributions of census tracts from the dataset dividing the total population by 20 (https://portaldades.ajuntament.barcelona.cat/ca/estadístiques/yzlntdm2fs).
Usage
BarcelonaPop
Format
A SpatialPointsDataFrame with 81359 rows and 2 attributes:
- age
age the individual
- sex
sex of the individual as a factor with levels: "man", "woman"
Census tract borders of Charleston, SC MSA, USA.
Description
A SpatiaPolygons object containing the Census tract borders of Charleston, SC MSA, USA.
Usage
CharlestonCensusTracts
Format
A SpatialPolygons object with 117 polygons
Radomly created population points for Charleston, SC MSA, USA.
Description
A dataset containing randomly created population for Charleston, SC MSA, USA. Population has been created randomly with distributions of census tracts from the dataset Charleston1, 2000 Census Tract Data for Charleston, SC MSA and counties
Usage
CharlestonPop
Format
A SpatialPointsDataFrame with 54619 rows and 3 attributes:
- age
group age the individual as a factor with levels: "under16", "16_65", "over65"
- sex
sex of the individual as a factor with levels: "male", "female"
- origin
origin of the individual as a factor with levels: "asian", "black", "hisp", "multi_ra", "white"
See Also
https://spatial.uchicago.edu/sample-data
[<- AQuadtree-method
Description
Method [<-
Usage
## S4 replacement method for signature 'AQuadtree'
x[i, j, ...] <- value
Arguments
x |
an object of class AQuadtree. |
i, j |
elements to extract or replace. |
... |
passed through. |
value |
value to set. |
Details
An AQuadtree object cannot be assigned directly
Value
none
[ AQuadtree-method
Description
Method [
Usage
## S4 method for signature 'AQuadtree'
x[i, j, ..., drop = TRUE]
Arguments
x |
an object of class AQuadtree. |
i, j |
elements to extract. |
... |
passed through. |
drop |
passed on to [ indexing operator. |
Details
Extract a part of a AQuadtree object
Value
An AQuadtree object with the selected subset of rows or columns from the input object.
area.QT AQuadtree-method
Description
Method area.QT
Usage
area.QT(obj, residual = TRUE, ...)

## S4 method for signature 'AQuadtree'
area.QT(obj, residual = FALSE, ...)
Arguments
obj |
an object of class AQuadtree. |
residual |
logical; if TRUE cells marked as residual cells are included |
... |
passed through. |
Details
Get the areas of the Quadtree grid cells in square meters
Value
area of Quadtree grid cells in square meters
Create a Quadtree grid to anonymise spatial point data
Description
createAQuadtree returns a SpatialPointsDataFrame representing a Quadtree
hierarchical geographic dataset. The resulting grid contains varying size cells
depending on a given threshold and column.
with identifiers
A cellCode and cellNum is created for each cell as in INSPIRE
Specification on Geographical Grid Systems.
Usage
createAQuadtree(
  points,
  dim = 1000,
  layers = 5,
  colnames = NULL,
  threshold = 100,
  thresholdField = NULL,
  funs = NULL,
  as = "Spatial",
  ineq.threshold = 0.25,
  loss.threshold = 0.4
)
Arguments
points |
object of class "SpatialPoints" or "SpatialPointsDataFrame". |
dim |
a single integer specifying the initial cell sizes in meters, defaults to 1000. |
layers |
a single integer specifying the number of divisions of the initial cells, defaults to 5. |
colnames |
character or character vector specifying the columns to summarise in the resulting quadtree. For columns of class factor, a column for each factor level cill be created. |
threshold |
number. The threshold minimum value each cell must have
in the column |
thresholdField |
character or character vector specifying the
columns to which the |
funs |
character or character vector specifying the summary
functions for each of the |
as |
character indicating return type, if "AQuadtree" a quadtree class element will be returned, otherwise a SpatialPolygonsDataFrame will ber returned. Defaults to "Spatial". |
ineq.threshold |
inequality threshold value to be considered on the disaggregation process. Forces disaggregation under the given inequality threshold. |
loss.threshold |
loss threshold value to be considered on the disaggregation process. Stops disaggregation when there's much loss (i.e loss rate > ineq.threshold ). |
Details
Given a set of points a varying size Quadtree grid is created performing a
bottom-up aggregation considering a minimum threshold for each cell.
Cells with a value under the threshold for the thresholdField are
aggregated to the upper level in a quadtree manner.
When no thresholdField is given, total number of points in the cell
will be used, and so, given a threshold of k, none of the cells in the
resulting grid have a value less than k individuals as in a k-anonymity model.
The Quadtree produced balances information loss and accuracy. For instance,
for the set of cells in the left image, where numbers in the cells represent
the values in the thresholdField, using a threshold value of 100,
the resulting Quadtree will be the one on the right. As we can see, some cells
will be discarded, and some aggregated to maintain as much information as
possible, keeping at the same time as much disaggregation as possible
The INSPIRE coding system for cell identifiers will be used to generate a
cellCode and cellNum for each cell in the Quadtree.
The objective of the coding system is to generate unique
identifiers for each cell, for any of the resolutions.
The cellCode is a text string, composed of cell size and cell coordinates.
Cell codes start with a cell size prefix. The cell size is denoted in meter (m)
for cell sizes below 1000 m and kilometre (km) for cell sizes from 1000 m and
above.
Examples: a 100 meter cell has an identifier starting with “100m”, the
identifier of a 10000 meter cell starts with “10km”.
The coordinate part of the cell code reflects the distance of the lower left
grid cell corner from the false origin of the CRS. In order to reduce the
length of the string, Easting (E) and Northing (N) values are divided by
10^n (n is the number of zeros in the cell size value). Example for a cell
size of 10000 meters: The number of zeros in the cell size value is 4.
The resulting divider for Easting and Northing values is 10^4 = 10000.
The cellNum is a sequence of concatenated integers identifying all the
hierarchical partitions of the main cell in which the point resides.
For instance, the cellNum of the top right cell would be 416 (fourth
in first partition, sixteenth in second partition)
The input object must be projected and units should be in 'meters'
because the system uses the INSPIRE coding system.
Value
SpatialPolygonsDataFrame representing a varying size Quadtree aggregation for the given points.
See Also
-
INSPIRE Data Specification on Geographical Grid Systems – Technical Guidelines https://knowledge-base.inspire.ec.europa.eu/publications/inspire-data-specification-geographical-grid-systems-technical-guidelines_en
-
EEA reference grid dataset https://data.europa.eu/euodp/data/dataset/data_eea-reference-grids-2
Examples
data("CharlestonPop")
aQuadtree.Charleston<-createAQuadtree(CharlestonPop, threshold=10,
  colnames="sex", thresholdField=c("sex.male", "sex.female"))
Create a Grid grid covering a given geographic zone.
Description
createGrid returns a SpatialPolygons object representing a grid
covering a given geographic zone following the INSPIRE Specification on
Geographical Grid Systems. Each polygon will be identified with it's CellCode
code.
Usage
createGrid(zone, dim = 1000, intersect = TRUE, outline = FALSE)
Arguments
zone |
object of class "SpatialPoints", "SpatialPointsDataFrame", "SpatialPolygons" or "SpatialPolygonsDataFrame" specifying the zone to be covered by the grid. |
dim |
a single integer specifying the initial cell sizes in meters, defaults to 1000. |
intersect |
logical, if TRUE the resulting grid will be intersected with the given zone. If zone is of class SpatialPoints, only cells containing points will be kept on the resulting grid. If zone is of class SpatialPolygons, only cells inside or partially inside polygons in zone will be kept on the resulting grid. Defaults to TRUE |
outline |
logical, if TRUE the resulting grid will be clipped with the outlines of the given zone. Only applicable if zone is of class SpatialPolygons. Defaults to FALSE |
Details
INSPIRE Specification on Geographical Grid Systems
The objective of the coding system is to generate unique identifiers for each
point, for any of the recommended resolutions.
The cellCode is a text string, composed of cell size and cell coordinates.
Cell codes start with the cell's size prefix. The cell size is denoted in meter (m)
for cell sizes below 1000m and kilometre (km) for cell sizes from 1000m and
above.
Examples: a 100 meter cell has an identifier starting with “100m”, the
identifier of a 10000 meter cell starts with “10km”.
The coordinate part of the cell code reflects the distance of the lower left
grid cell corner from the false origin of the CRS. In order to reduce the
length of the string, Easting (E) and Northing (N) values are divided by
10^n (n is the number of zeros in the cell size value). Example for a cell
size of 10000 meters: The number of zeros in the cell size value is 4.
The resulting divider for Easting and Northing values is 10^4 = 10000.
Value
SpatialPolygons dataset representing a grid with squared cells of the given size.
See Also
-
INSPIRE Data Specification on Geographical Grid Systems – Technical Guidelines https://knowledge-base.inspire.ec.europa.eu/publications/inspire-data-specification-geographical-grid-systems-technical-guidelines_en
-
EEA reference grid dataset https://data.europa.eu/euodp/data/dataset/data_eea-reference-grids-2
Examples
data("BarcelonaPop")
BarcelonaPop.INSPIRE_GRID<-createGrid(BarcelonaPop)
plot(BarcelonaPop.INSPIRE_GRID)

## Not run:
BarcelonaPop.INSPIRE_GRID.10km<-createGrid(BarcelonaPop, 10000, intersect=FALSE)
plot(BarcelonaPop.INSPIRE_GRID.10km)

data("BarcelonaCensusTracts")
Barcelona.INSPIRE_GRID<-createGrid(BarcelonaCensusTracts, outline=TRUE)
plot(Barcelona.INSPIRE_GRID)

## End(Not run)
Join two AQuadtree objects from the same area, to compare their data
Description
Given two objects of class AQuadtree for the same area, wich, for instance,
may contain data from two different periods, joinAQuadtrees
returns a new object of class AQuadtree with the common zones at the lowest
shared level, summarising the data from both AQuadtrees.
Usage
joinAQuadtrees(qt1, qt2, withResiduals = FALSE, mean.1 = NULL, mean.2 = NULL)
Arguments
qt1 |
object of class "AQuadtree" containing the first object to join. |
qt2 |
object of class "AQuadtree" containing the second object to join. |
withResiduals |
logical indicating if |
mean.1 |
character or character vector specifying the columns in the
first AQuadtreeto which a weighted mean should be computed. By default
the aggregation function used is |
mean.2 |
character or character vector specifying the columns in the
first AQuadtreeto which a weighted mean should be computed. By default
the aggregation function used is |
Details
The function joinAQuadtrees creates a new AQuadtree object from two
given AQuadtree objects with data from the same area. The data of the
two given objects is summarised at the smallest possible cells shared by
both given objects. All the input data is maintained on the new created
object. This function can be used to join the different attributes from
the same area or information from different periods.
Value
AQuadtree with the information of the two given objects summarised at the lowest level shared by both objects.
Examples
data("CharlestonPop")
CharlestonPop.AQT_1<-AQuadtree(CharlestonPop, layers = 2)
CharlestonPop.AQT_2<-AQuadtree(CharlestonPop, colnames="sex",
       thresholdField=c("sex.male", "sex.female"), layers = 2)
CharlestonPop.AQT_1_2<-joinAQuadtrees(CharlestonPop.AQT_1, CharlestonPop.AQT_2)

## Not run:
## non AQuadtree objects
joinAQuadtrees(CharlestonPop, CharlestonCensusTracts)

## End(Not run)
Merge an AQuadtree object with a data.frame
Description
Method merge.
Usage
## S4 method for signature 'AQuadtree,data.frame'
merge(x, y)
Arguments
x |
an object of class AQuadtree. |
y |
an object of class data.frame |
Details
Merges the AQuadtree object data with the data.frame on the columns "cellCode" and cellNum"
Value
An AQuadtree object where the data is extended with the input data.frame
plot AQuadtree-method
Description
Method plot
Usage
## S4 method for signature 'AQuadtree,missing'
plot(x, ..., residual = TRUE, add = FALSE, col)
Arguments
x |
an object of class AQuadtree. |
... |
passed through. |
residual |
logical; if TRUE cells marked as residual cells are included |
add |
logical. TRUE to add plot to the current existing plot |
col |
default plotting color |
Details
Plot an object of class AQuadtree.
Value
none
Add SpatialPoints to an AQuadtree obtject.
Description
Given an object of class AQuadtree and an object of class SpatialPoints or
SpatialPointsDataFrame for the same area, pointsToAQuadtree
returns a new object of class AQuadtree aggregating the data from the points
to the cells where each point fall.
Usage
pointsToAQuadtree(qt, points)
Arguments
qt |
object of class "AQuadtree". |
points |
object of class "SpatialPoints" or "SpatialPointsDataFrame". |
Details
The function pointsToAQuadtree returns a new AQuadtree object with
the input set of points aggregated to the input AQuadtree object. The function
creates a “p.total” attribute to compute the total
number of points aggregated to each cell of the input AQuadtree.
If points is an object of class SpatialPointsDataFrame, the function
summarises numeric attributes in the dataframe using the mean
function, and deploys factor attributes creating a new attribute for each label of the
factor to calculate the count. The attributes added to the resulting
AQuadtree object are prefixed with “p.”.
Value
AQuadtree with the information of the given set of points aggregated at each corresponding cell of the given AQuadtree.
Examples
data("BarcelonaPop")
Barcelona.QT<-AQuadtree(BarcelonaPop)
BcnWomen75yPop<-BarcelonaPop[BarcelonaPop$sex=='woman' & BarcelonaPop$age>=75, 'age']
Barcelona.extended.QT<-pointsToAQuadtree(Barcelona.QT, BcnWomen75yPop)

## Not run:
## not an AQuadtree object
pointsToAQuadtree(CharlestonCensusTracts, CharlestonPop)

## spatial object not projected
sp.not.projected<-spTransform(CharlestonPop,CRS("+proj=longlat +datum=NAD27"))
is.projected(sp.not.projected)
pointsToAQuadtree(AQuadtree(CharlestonPop), sp.not.projected)


## End(Not run)
print AQuadtree-method
Description
Method print.
Usage
## S4 method for signature 'AQuadtree'
print(x, ...)
Arguments
x |
an object of class AQuadtree. |
... |
passed through. |
Details
Prints the AQuadtree object
Value
none
show AQuadtree-method
Description
Method show.
Usage
## S4 method for signature 'AQuadtree'
show(object)
Arguments
object |
an object of class AQuadtree. |
Details
Display the AQuadtree object
Value
A data.frame showing the information attributes contained in the AQuadtree object.
Add cell identifiers to SpatialPoints as in INSPIRE Specification
Description
spatialPointsCellCodes returns a SpatialPointsDataFrame with identifiers
(CellCode and CellNum) for each point as in INSPIRE Specification on Geographical
Grid Systems.
Usage
spatialPointsCellCodes(points, dim = 1000, layers = 1)
Arguments
points |
object of class "SpatialPoints" or "SpatialPointsDataFrame". |
dim |
a single integer specifying the initial cell sizes, defaults to 1km. |
layers |
a single integer specifying the number of divisions of the initial cells, defaults to 1. |
Details
INSPIRE coding system for point identifiers
The objective of the coding system is to generate unique identifiers for each
point, for any of the recommended resolutions.
The cellCode is a text string, composed of cell size and cell coordinates.
Cell codes start with a cell size prefix. The cell size is denoted in meter (m)
for cell sizes below 1000 m and kilometre (km) for cell sizes from 1000 m and
above.
Examples: a 100 meter cell has an identifier starting with “100m”, the
identifier of a 10000 meter cell starts with “10km”.
The coordinate part of the cell code reflects the distance of the lower left
grid cell corner from the false origin of the CRS. In order to reduce the
length of the string, Easting (E) and Northing (N) values are divided by
10n (n is the number of zeros in the cell size value). Example for a cell
size of 10000 meters: The number of zeros in the cell size value is 4.
The resulting divider for Easting and Northing values is 104 = 10000.
The cellNum is a sequence of concatenated integers identifying all the
hierarchical partitions of the main cell in which the point resides.
For instance, the cellNum of the top right cell would be 416 (fourth
in first partition, sixteenth in second partition)
The input object must be projected and units should be in 'meters' because the system uses the INSPIRE coding system.
Value
A "SpatialPointsDataFrame" containing all the points given. For
each point a cellCode and cellNum identify the cell to which the point belongs.
CellCode is a text string, composed of cell size and cell coordinates.
Cell codes start with a cell size prefix. The cell size is denoted in meter (m)
for cell sizes below 1000 m and kilometer (km) for cell sizes from 1000 m and
above.
The cellNum is a sequence identifying the different partitions of the main
cell in which the point resides.
See Also
-
INSPIRE Data Specification on Geographical Grid Systems – Technical Guidelines https://knowledge-base.inspire.ec.europa.eu/publications/inspire-data-specification-geographical-grid-systems-technical-guidelines_en
-
EEA reference grid dataset https://data.europa.eu/euodp/data/dataset/data_eea-reference-grids-2
Examples
data("BarcelonaPop")
BarcelonaPop.IDs<-spatialPointsCellCodes(BarcelonaPop)
BarcelonaPop.IDs.10km<-spatialPointsCellCodes(BarcelonaPop, 10000, 3)

## Not run:
## spatial object not projected
sp.not.projected<-spTransform(CharlestonPop,CRS("+proj=longlat +datum=NAD27"))
is.projected(sp.not.projected)
spatialPointsCellCodes(sp.not.projected)

## End(Not run)
Split CellNum sequence into a vector
Description
createQuadtree returns a vector decomposing the given CellNum into the
sequence of the different cell numbers for each level.
Usage
splitCellNum(x)
Arguments
x |
a character or character vector containing a sequence of cell numbers or an R object with a field named 'cellNum' |
Details
CellNum is an integer with the concatenated sequence of hierarchical cell positions
inside a main cell. splitCellNum splits that sequence into a vector.
For instance, the CellNum of the top right cell would be 416 (fourth
in first partition, sixteenth in second partition)
Value
integer vector or list of integer vectors with the sequence CellNums splitted
See Also
-
INSPIRE Data Specification on Geographical Grid Systems – Technical Guidelines https://knowledge-base.inspire.ec.europa.eu/publications/inspire-data-specification-geographical-grid-systems-technical-guidelines_en
-
EEA reference grid dataset https://data.europa.eu/euodp/data/dataset/data_eea-reference-grids-2
Examples
data("CharlestonPop")
CharlestonPop.IDs<-spatialPointsCellCodes(CharlestonPop, layers=2)
splitCellNum(CharlestonPop.IDs)
spplot AQuadtree-method
Description
Method spplot
Usage
## S4 method for signature 'AQuadtree'
spplot(obj, zcol = NULL, by.density = TRUE, residual = TRUE, ...)
Arguments
obj |
an object of class AQuadtree. |
zcol |
character; attribute name(s) or column number(s) in attribute table |
by.density |
logical; if TRUE cell values specified in zcol are divided by cell areas |
residual |
logical; if TRUE cells marked as residual cells are included |
... |
passed through. |
Details
Plots a AQuadtree object as a spatial object with its data
Value
Creates a lattice plot of class "trellis" created with the spplot method in the sp package
summary AQuadtree-method
Description
Method summary.
Usage
## S4 method for signature 'AQuadtree'
summary(object, ...)
Arguments
object |
an object of class AQuadtree. |
... |
passed through. |
Details
summarize information of an object of class AQuadtree
Value
An object of class "table" with summarising information in the AQuadtree input object